


Betting Knowledge Series — Lesson 19
Building a Predictive Model: Turning Data Into Probabilities
Introduction
Every professional bettor (whether they use spreadsheets or machine learning) is doing the same thing:
Estimating the true probability of an event, and comparing it to the market’s implied probability.
This lesson demystifies modeling.
Estimating the true probability of an event, and comparing it to the market’s implied probability.
This lesson demystifies modeling.
You don’t need to be a data scientist to build something meaningful. You just need logic, structure, and the willingness to let numbers speak louder than bias.
1. What Is a Predictive Model?
A predictive model is a structured formula or algorithm that uses historical data to estimate the likelihood of future outcomes.
In betting, that means translating match data into probabilities for results, goals, or other markets.
It can be as simple as a weighted average in Excel, or as complex as a logistic regression.
The sophistication matters less than clarity and consistency.
A good model is one you understand well enough to trust and question.
2. The Core Idea: From Input to Probability
At its simplest, a model takes inputs (features) → applies logic → outputs probabilities.
Example:
Inputs Logic Output Home xG, Away xG, Rest Days, League Avg Goals Compare team strength vs average P(Home Win) = 0.47
That 47% becomes your true probability.
Compare it to market odds:
If market implies 43% (odds 2.33) → value exists.
If market implies 50% (odds 2.00) → no value.
3. Choosing the Right Variables
Your data should already contain hundreds of points, but you don’t need them all.
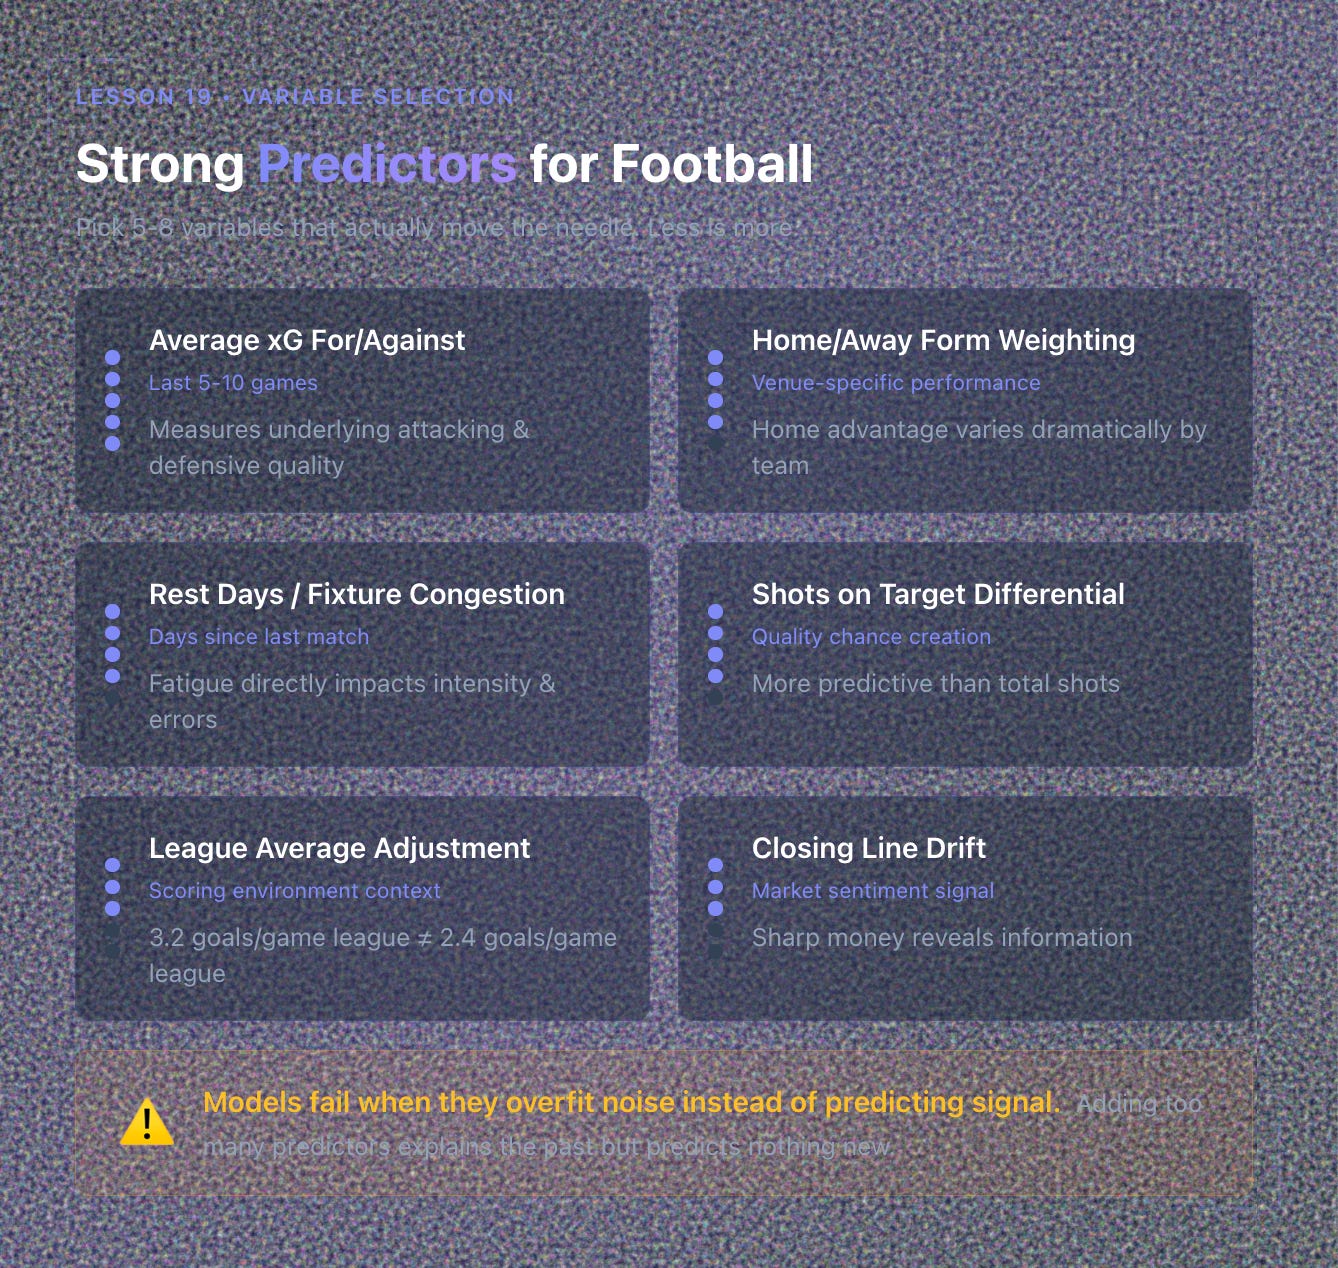
Pick 5–8 variables that actually move the needle.
Strong Predictors for Football:
Average xG for / against (last 5 or 10 games).
Home/Away form weighting.
Rest days or fixture congestion.
Shots on target differential.
League average adjustment (scoring environment).
Recent odds closing line drift (market sentiment).
Less is more.
Models fail when they overfit noise instead of predicting signal.
4. Building a Simple Linear Model (Excel or Sheets)
If you’re not coding yet, start here.
Collect Sample: 300+ matches with inputs and actual results (like 1 for win, 0 for loss).
Run Linear Regression:
Dependent variable = result (1/0).
Independent variables = your predictors (xG diff, shots, etc.).
Interpret Coefficients: Each variable gets a weight showing how strongly it predicts success.
Generate Probability: Multiply coefficients × variables for each new match to get a “score,” then convert using the logistic function:
P = 1 / (1 + e^(-Z))
where Z = your weighted score.
This gives a probability between 0 and 1.
5. Poisson Model for Goal Markets
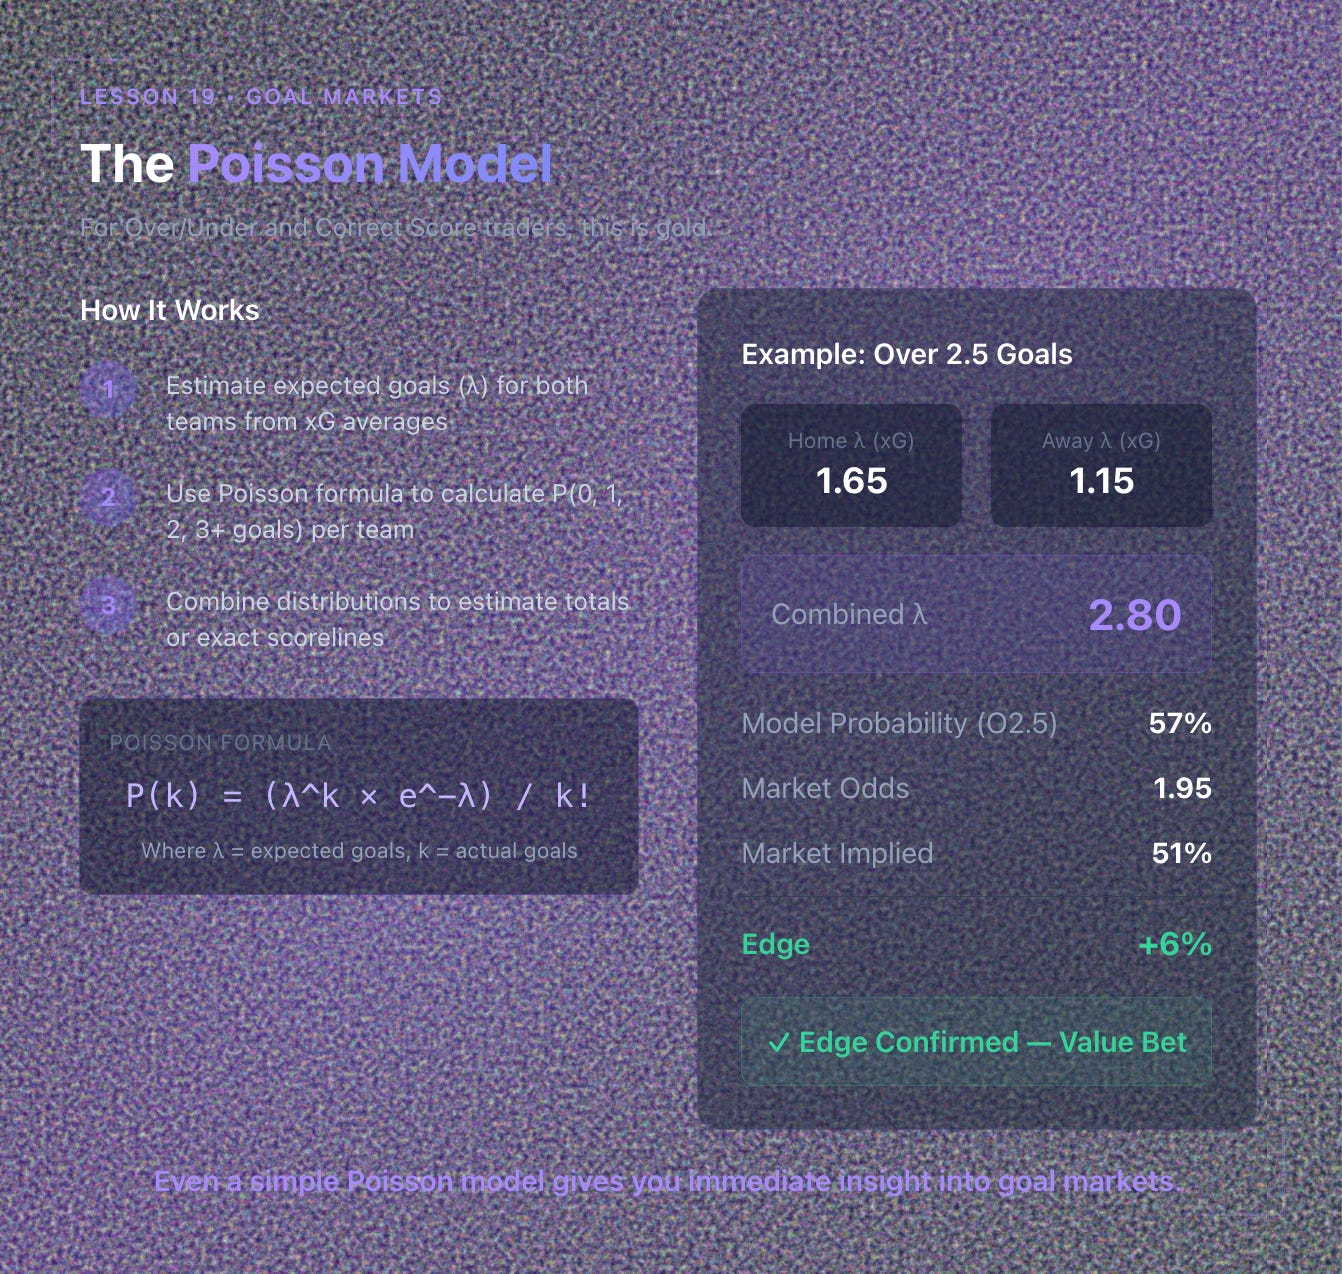
For Over/Under and Correct Score traders, the Poisson distribution is gold.
Steps:
Estimate expected goals (λ) for both teams from xG averages.
Use Poisson formula to calculate probability of 0, 1, 2, 3+ goals per team.
Combine distributions to estimate total goals or exact scorelines.
Example:
If combined λ = 2.8 → probability(Over 2.5) ≈ 57%.
Market odds = 1.95 (implied 51%).
✅ Edge confirmed.
Even a simple Poisson model gives you immediate insight into goal markets.
6. Validating Your Model
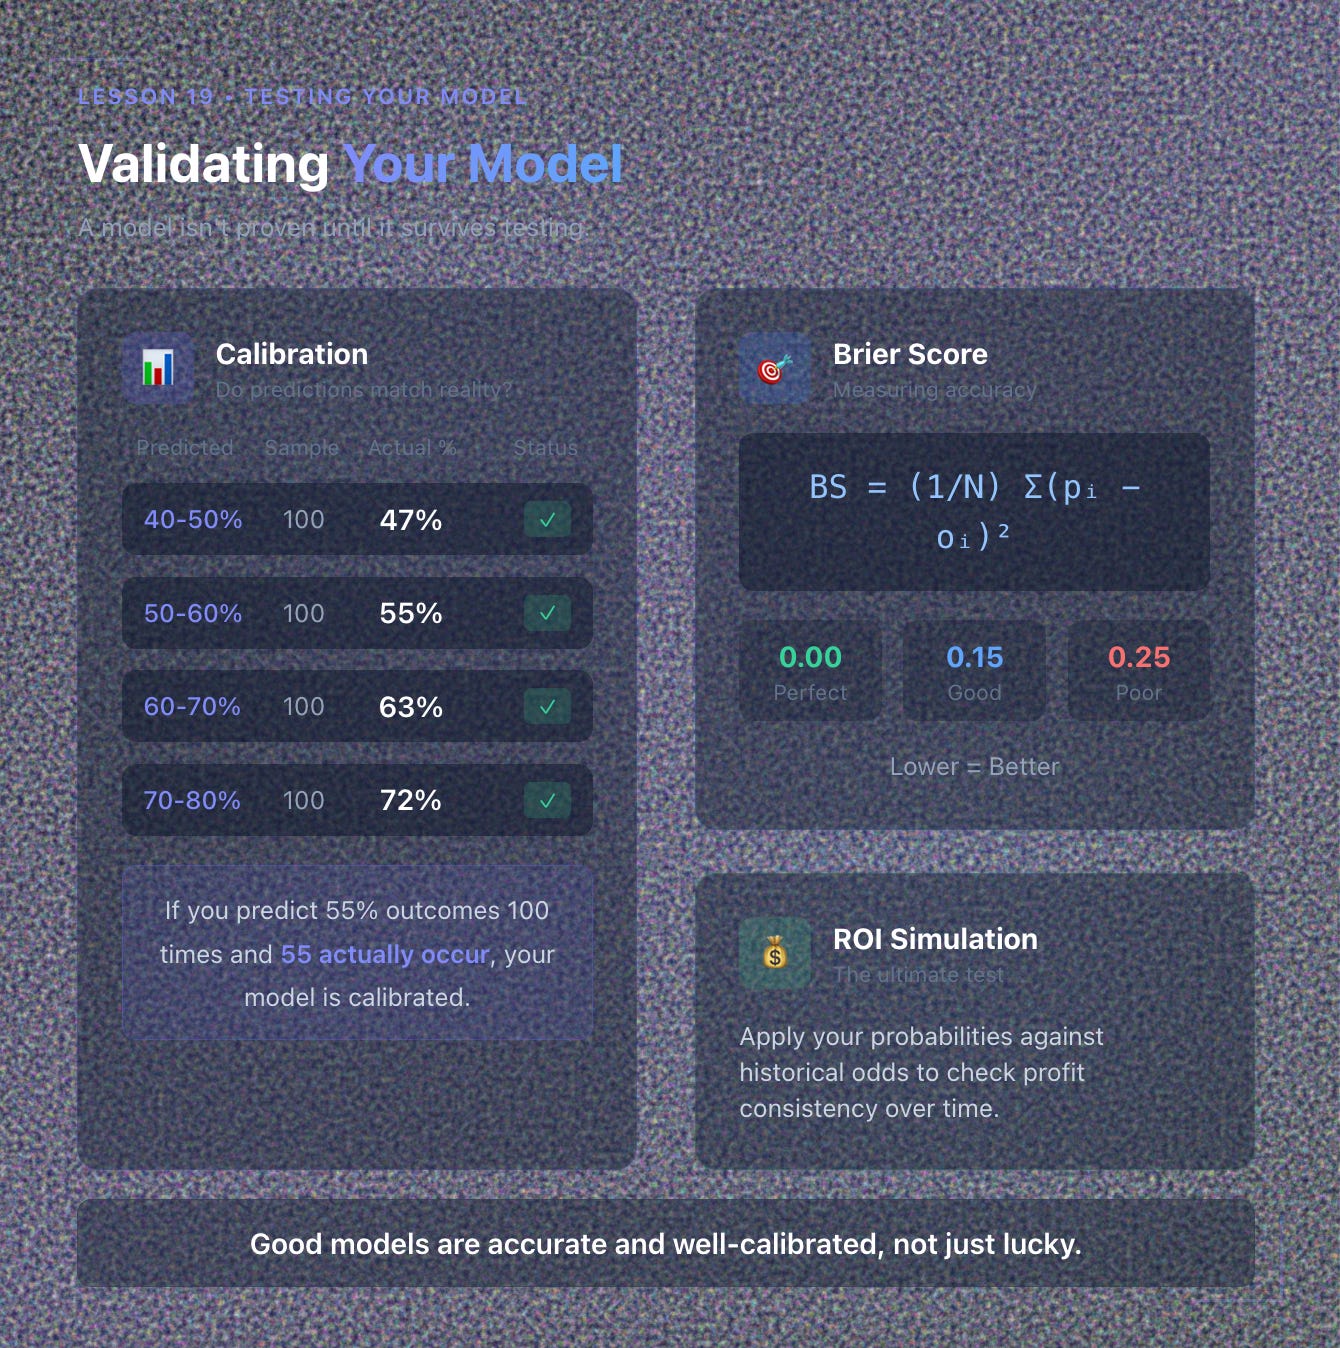
A model isn’t proven until it survives testing.
Validation means checking how accurate your probabilities are.
Calibration:
Group predictions by probability (like 0.4–0.5, 0.5–0.6).
If you predict 55% outcomes 100 times and 55 actually occur, your model is calibrated.
Brier Score:
BS = (1/N)Σ(p_i - o_i)²
Lower = better accuracy (0 = perfect).
ROI Simulation: Apply your probabilities against historical odds to check profit consistency.
Good models are accurate and well-calibrated, not just lucky.
7. Avoiding Common Modeling Mistakes
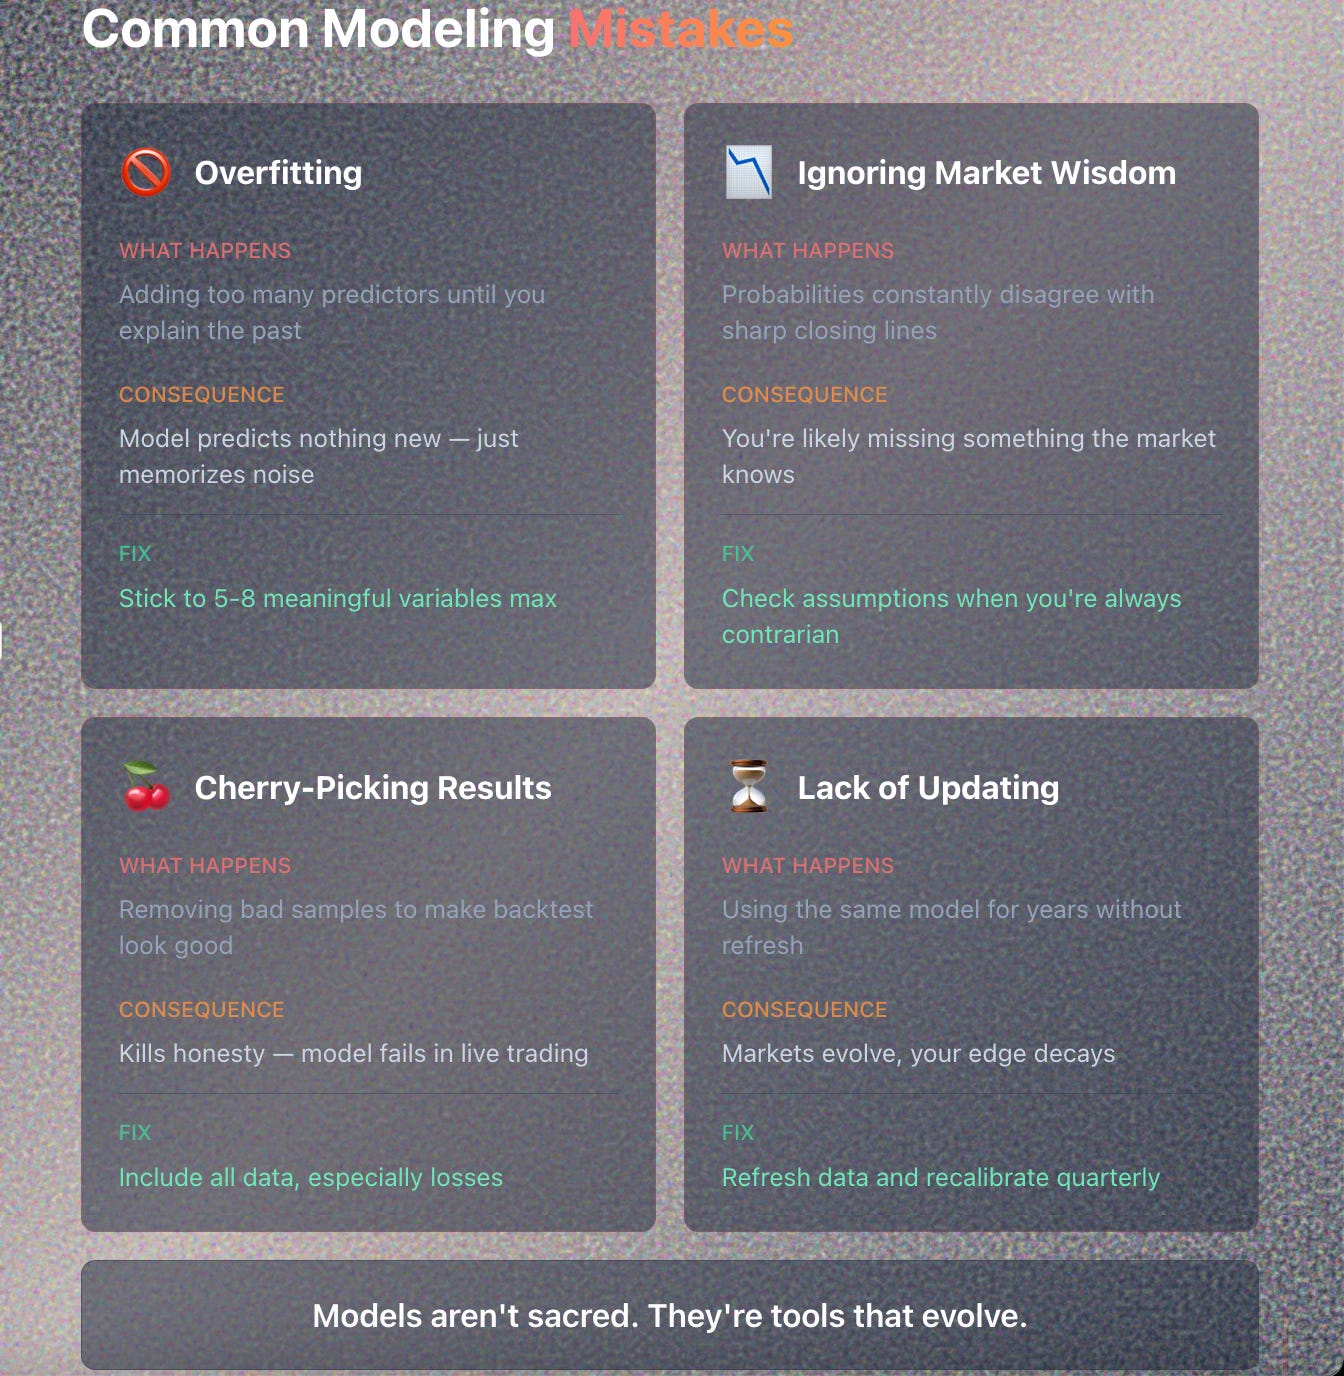
🚫 Overfitting: Adding too many predictors until you explain the past but predict nothing new.
🚫 Ignoring Market Wisdom: If your probabilities constantly disagree with sharp closing lines, check assumptions.
🚫 Cherry-Picking Results: Removing bad samples kills honesty.
🚫 Lack of Updating: Models degrade. Refresh data quarterly.
Remember: models aren’t sacred. They’re tools that evolve.
8. Combining Model Output With Market Prices
The model’s job is not to replace odds. It’s to challenge them.
For each market:
Compare your model probability vs implied market probability (1 / odds).
Calculate EV:
EV = (P_model × Odds) - 1
Rank opportunities by EV magnitude, not gut feel.
Trade only positive EV entries (≥ +2% threshold).
Automation does this comparison in seconds once your data’s structured.
9. Improving Over Time
Your model is a living organism.
Enhance it through:
Rolling averages to adapt to current form.
Weighting recent matches more heavily.
Testing new variables (weather, travel, xGA regression).
Regular back-testing to maintain calibration.
Evolution > Perfection.
10. The Professional Modeling Mindset
Professionals treat their models as advisors, not oracles.
They blend quantitative output with qualitative insight: injuries, tactics, motivation.
“The model tells me what should happen; my judgment decides when to trust it.”
When intuition and numbers align, that’s where the best trades live.
Key Takeaways
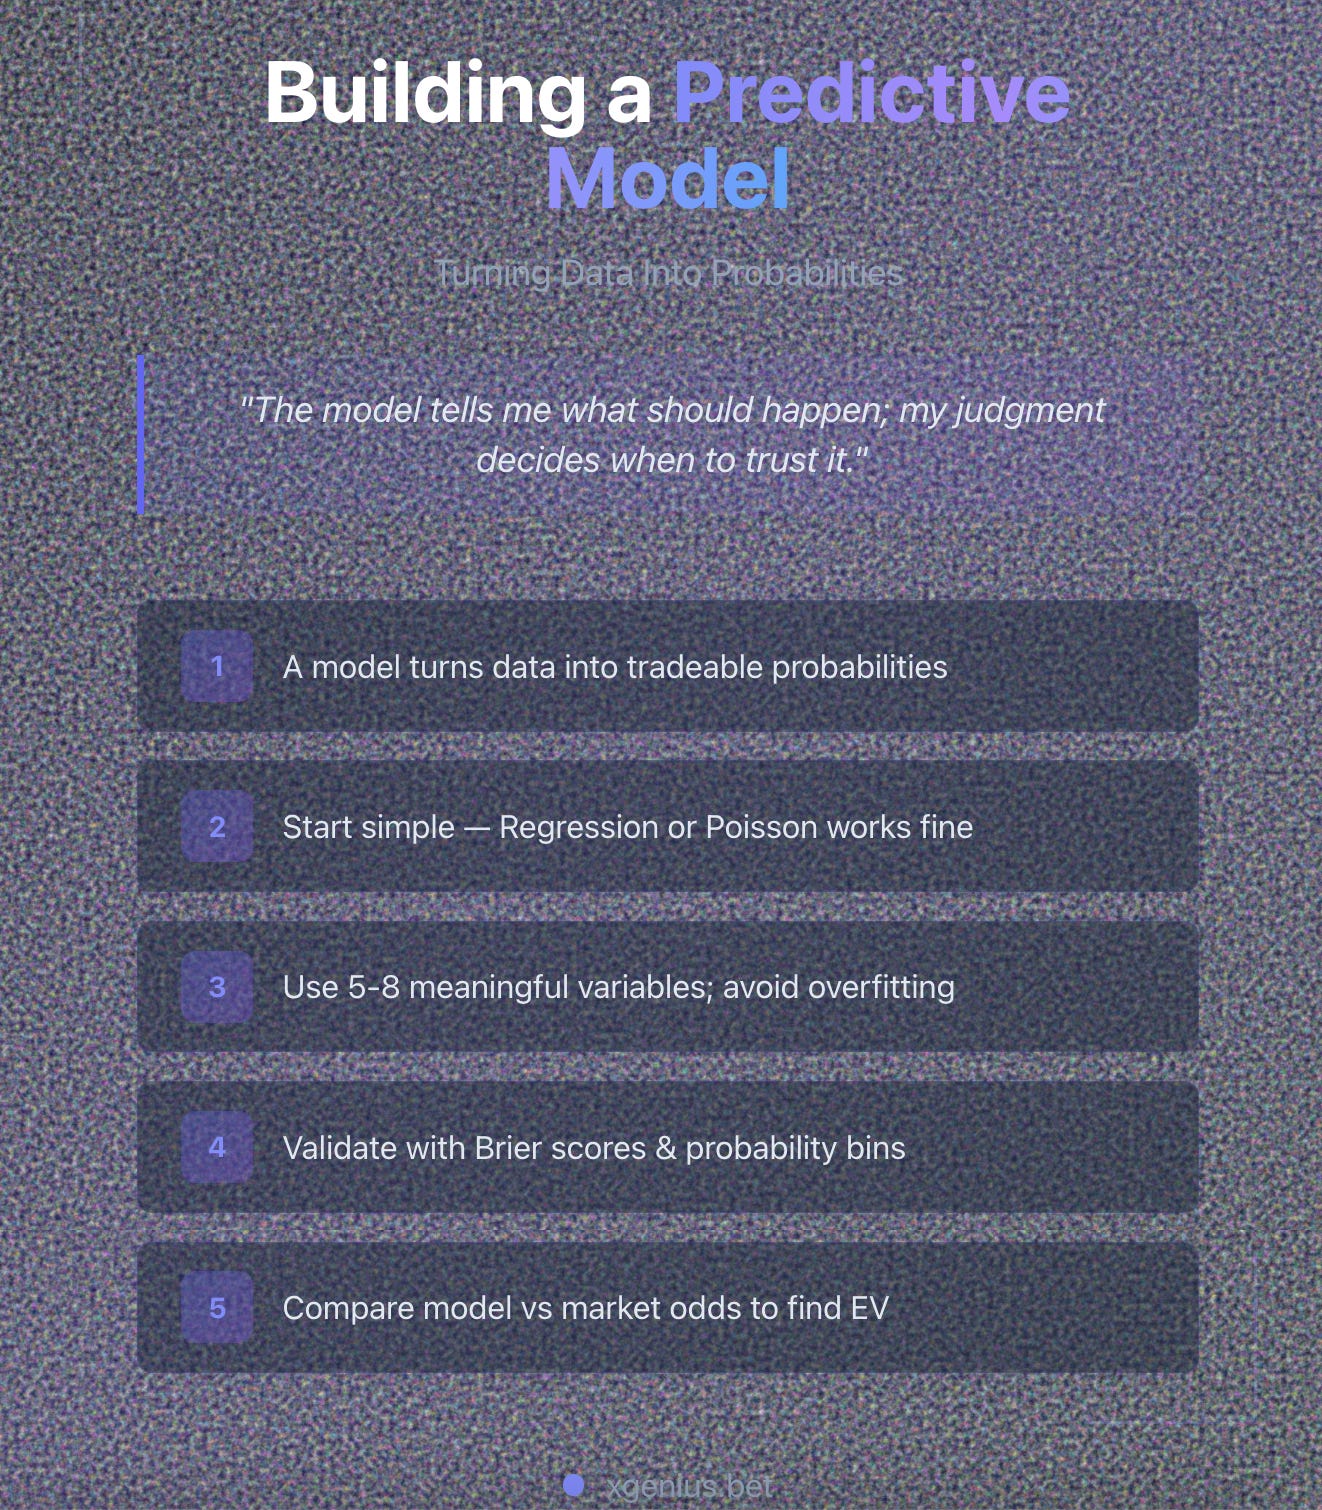
✅ A predictive model turns data into probabilities you trade.
✅ Start simple. Regression or Poisson works fine.
✅ Use 5–8 meaningful variables; avoid overfitting.
✅ Validate calibration with Brier scores or probability bins.
✅ Compare model probability vs market odds to find EV.
✅ Update, test, and refine continuously.
Next Lesson
📘 Lesson 20: Building the Ultimate EV Dashboard — Automating Your Edge
We’ll bring everything together by showing how to build a live Expected Value dashboard, one that automatically pulls data, compares it to market prices, and highlights high-value trades in real time.