


Betting Knowledge Series — Lesson 16
Building Your Betting Journal: A Data-Driven Approach
Introduction
You can’t fix what you don’t track.
The difference between a good bettor and a great one isn’t talent. It’s data discipline.
A proper betting journal turns every wager into feedback.
It tells you which systems truly work, where your leaks hide, and how to refine performance like a scientist rather than a gambler.
This lesson walks you through creating, maintaining, and analyzing a professional-grade betting log that actually makes you better.
1. Why Record-Keeping Matters
Most bettors remember wins, forget losses, and misjudge averages.
Memory is emotional. Spreadsheets are honest.
Tracking converts chaos into clarity. It helps you:
Quantify performance (ROI, hit rate, drawdown).
Identify leaks (markets, times, odds ranges).
Separate skill from luck (expected vs actual results).
Strengthen discipline. Writing things down makes rash decisions harder.
Every serious bettor becomes their own analyst.
2. The Anatomy of a Professional Betting Journal
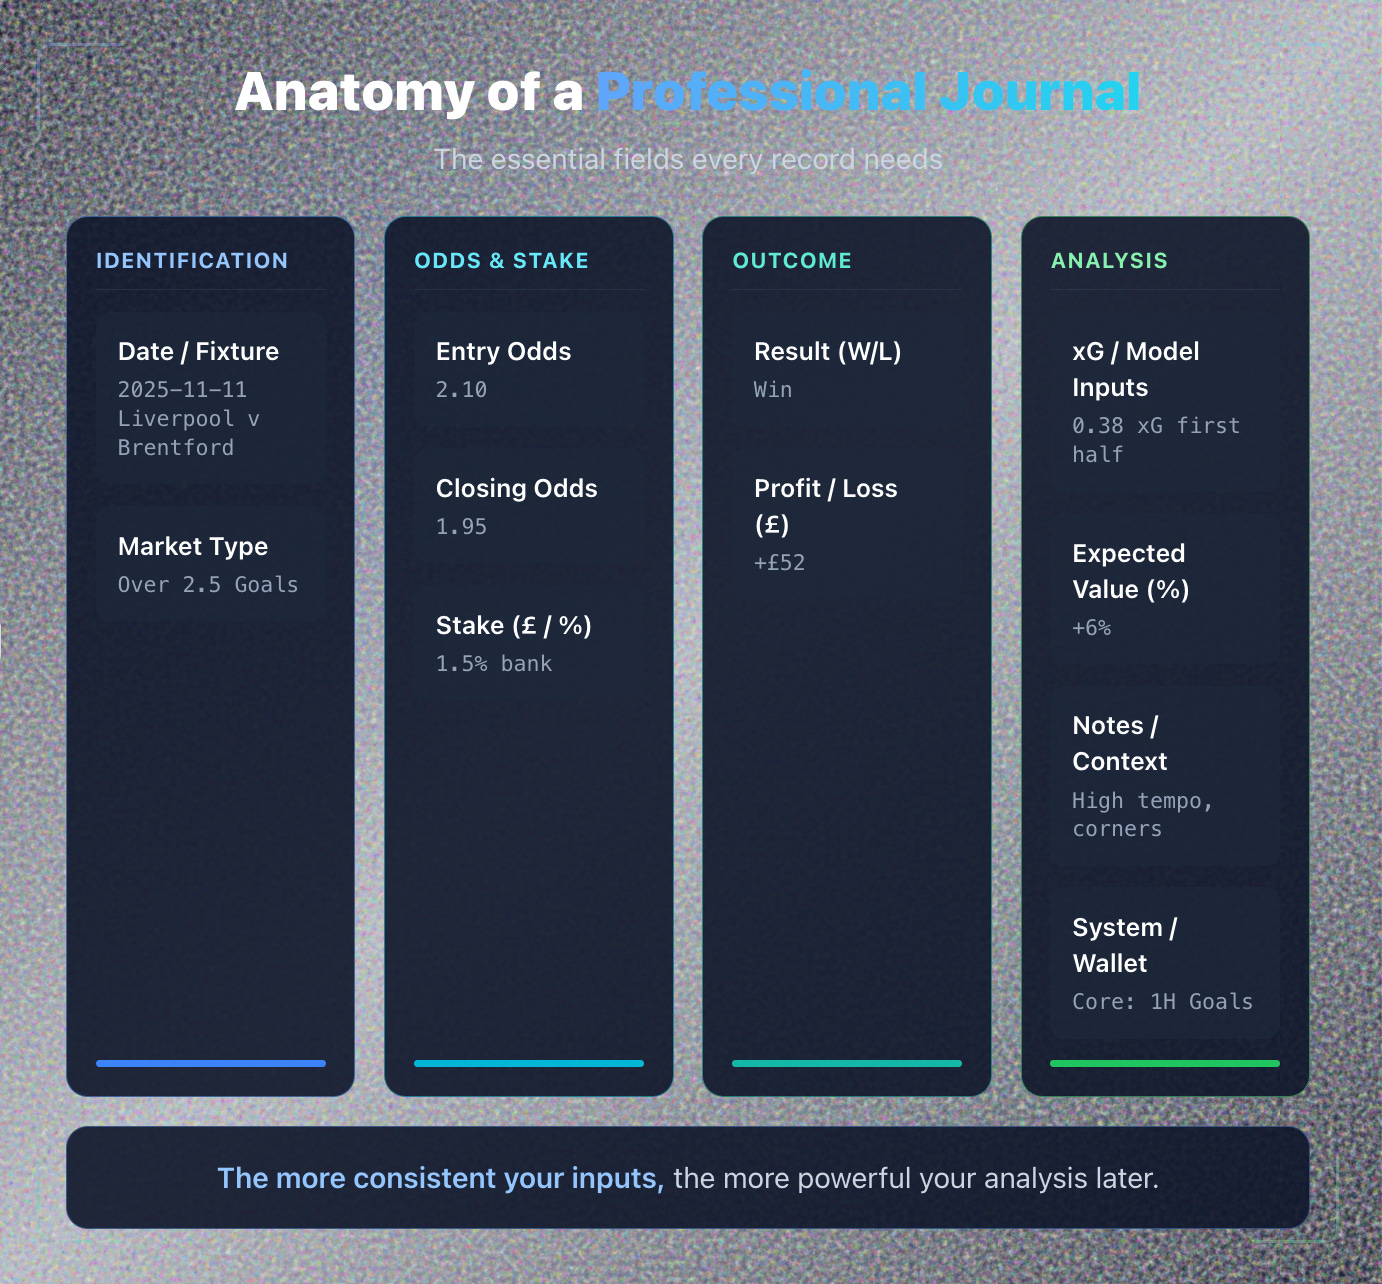
At minimum, your journal should include:
Category Example / Notes Date / Fixture 2025-11-11 Liverpool v Brentford Market Type Over 2.5 Goals Entry Odds 2.10 Closing Odds 1.95 Stake (£ / %) 1.5% bank Result (W/L) Win Profit / Loss (£) +£52 xG / Model Inputs 0.38 xG first half Expected Value (%) +6% Notes / Context High tempo, multiple corners System / Wallet Core: 1H Goals
The more consistent your inputs, the more powerful your analysis later.
3. Automating the Process
Manual tracking dies the moment it feels like homework.
Automate wherever possible:
Use Google Sheets or Excel formulas for ROI, win %, EV.
Add drop-down menus for markets or systems to keep data uniform.
Set conditional formatting to color-code profit/loss.
Connect APIs or data scrapers (SofaScore, OddsPortal) for automatic odds or xG imports if you’re technically inclined.
Automation turns discipline into habit

4. Key Metrics to Track
Metric Formula Purpose ROI Profit ÷ Total Staked × 100 Measures efficiency of capital use Strike Rate Wins ÷ Total Bets × 100 Shows hit frequency Average Odds Mean(odds) Evaluates risk profile Average EV Mean(expected value) Confirms theoretical edge Closing Line Value (CLV) (Closing - Entry) ÷ Entry × 100 Detects market beat Drawdown Peak - Trough loss % Reveals volatility Sharpe Ratio ROI ÷ Std Deviation Risk-adjusted performance
You don’t need them all from day one. Start with ROI, CLV, and Drawdown.
5. Tagging & Categorization
Tag every bet by market, league, and system.
Later you’ll use pivot tables to find hidden trends:
Filter ROI Volume EPL +7% 240 La Liga +1% 180 Championship -3% 150
Instantly you’ll know where to focus or what to retire.
Tagging transforms a spreadsheet into a decision engine.
6. Turning Data into Insight
Data alone isn’t knowledge. Interpretation is.
Monthly or quarterly:
Group results by system / market / odds range.
Rank by ROI and variance.
Cut the bottom performers (negative ROI > 200 bets).
Reinvest focus in the top quartile.
You’re not chasing profit. You’re optimizing process yield.
7. Visualizing Your Progress
Graphs make discipline rewarding.
Create charts for:
Cumulative Profit Curve: Shows long-term direction.
Monthly ROI Bar: Visual seasonality.
CLV Trend Line: Health of edge.
System Comparison Scatterplot: Risk vs return.
Seeing progress (or lack of it) keeps you objective and motivated.
8. The Feedback Loop
Your betting log forms the backbone of a feedback system:
Collect Data → record every trade.
Analyze Patterns → identify what works.
Refine Rules → adjust thresholds or filters.
Retest → feed updated logic back into live use.
This loop never stops.
Every completed cycle increases sharpness. Even losing trades add fuel for future accuracy.
9. Common Tracking Mistakes
🚫 Cherry-picking: Logging only winners.
🚫 Inconsistent Inputs: Mixing odds formats or missing fields.
🚫 Over-analysis: Drowning in 30 metrics, ignoring the core three.
🚫 Neglecting Context: Forgetting to note conditions (weather, fatigue, lineup).
🚫 Emotional Edits: “Adjusting” recorded results. Self-deception kills learning.
Honesty in data = honesty in process.
10. The Professional Record-Keeping Philosophy
A true professional views the journal not as paperwork but as a mirror.
It reflects both skill and psychology: discipline, patience, and reaction to variance.
Amateurs remember feelings. Professionals measure facts.
Each row in your spreadsheet is a lesson. Each summary report is your teacher.
The longer you maintain it, the stronger your edge becomes. Nothing exposes truth like your own numbers.
Key Takeaways
✅ Track every bet. Memory is emotional, data is objective.
✅ Automate calculations for ROI, CLV, and Drawdown.
✅ Tag bets by system and market for pivot analysis.
✅ Review monthly. Refine top performers, retire laggards.
✅ Visualize trends. Seeing data beats guessing trends.
✅ Your journal isn’t admin. It’s your competitive advantage.
Next Lesson
📘 Lesson 17: Back-Testing and Forward-Testing — How to Prove a Strategy Before You Risk Real Money
We’ll explore how to use historical data to simulate systems, validate performance, and ensure you never stake real capital on untested ideas again.