


Building Your EV Dashboard: Automating Your Edge
Introduction
A professional betting operation is 80% preparation and 20% execution.
Manual calculations, endless spreadsheets, and late decisions waste both energy and accuracy.
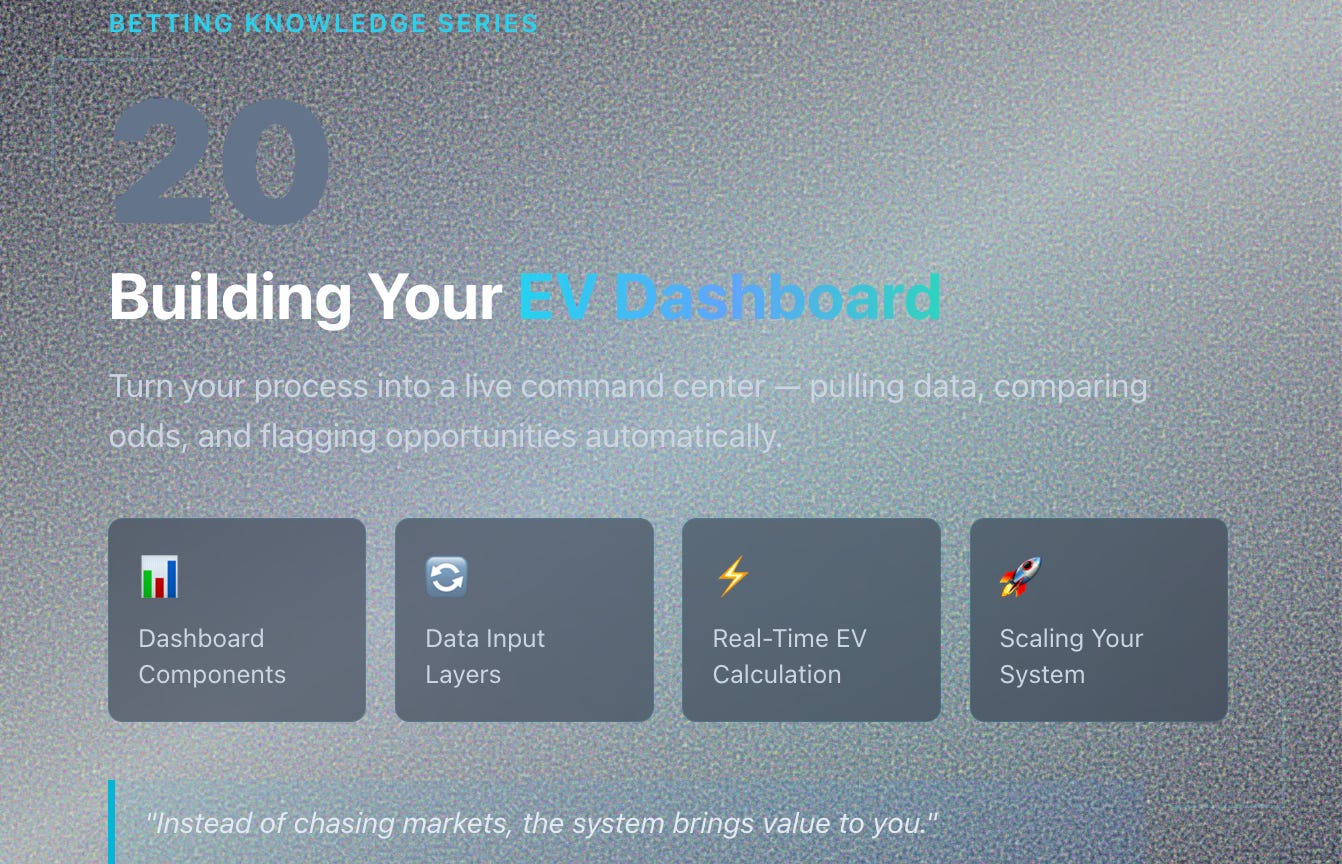
An Expected Value (EV) Dashboard turns your process into a live command center. Pulling data, comparing your model with market odds, and flagging opportunities automatically.
This lesson shows how to build one from scratch, using tools you already know.
1. What an EV Dashboard Does
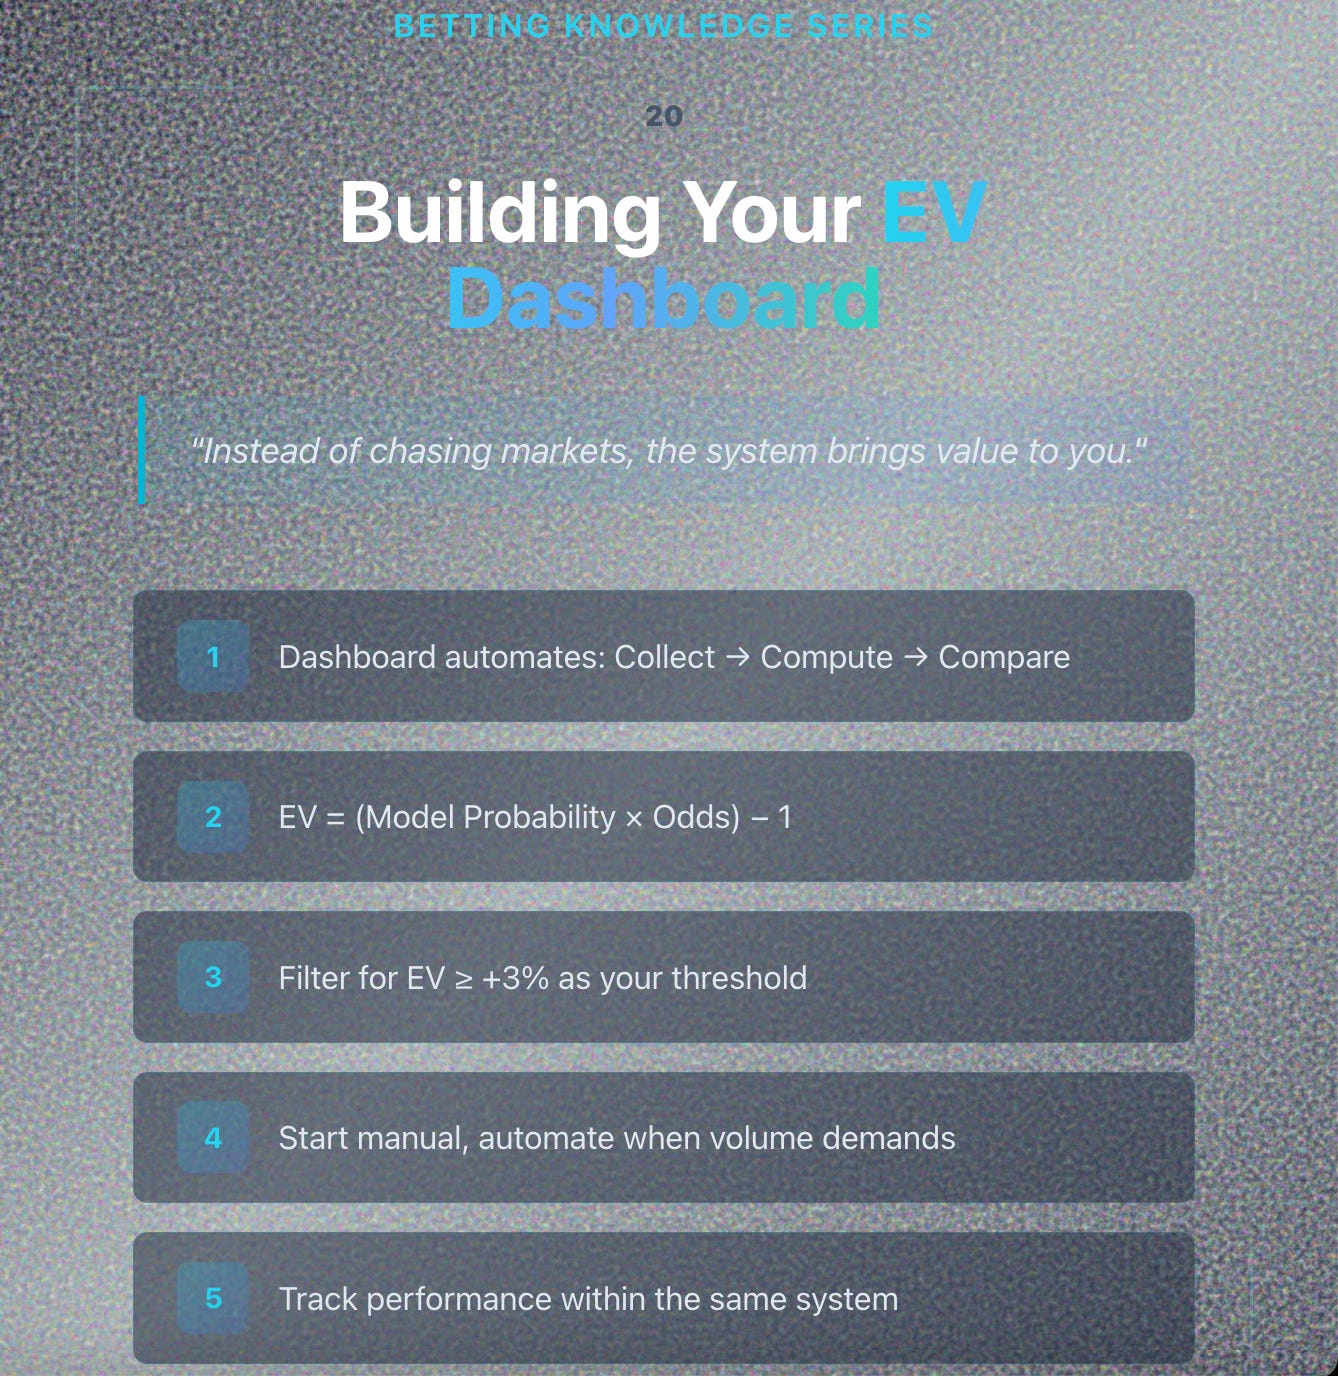
At its core, the dashboard performs three continuous actions:
Collect: Pull or import live odds and match data.
Compute: Apply your predictive model to generate true probabilities.
Compare: Calculate EV and highlight bets where value ≥ your threshold.
Instead of chasing markets, the system brings value to you.
2. The Components
You only need three layers to make it work:
Layer Tool Example Purpose Data Feed API (OddsAPI, Football-Data.org) Live odds & fixtures Logic Layer Google Sheets formulas / Python / R Convert data to true probabilities Interface Google Sheets dashboard or web app Display & filter opportunities
You can start with Sheets and evolve to code later. The concept stays the same.
3. Core Dashboard Layout
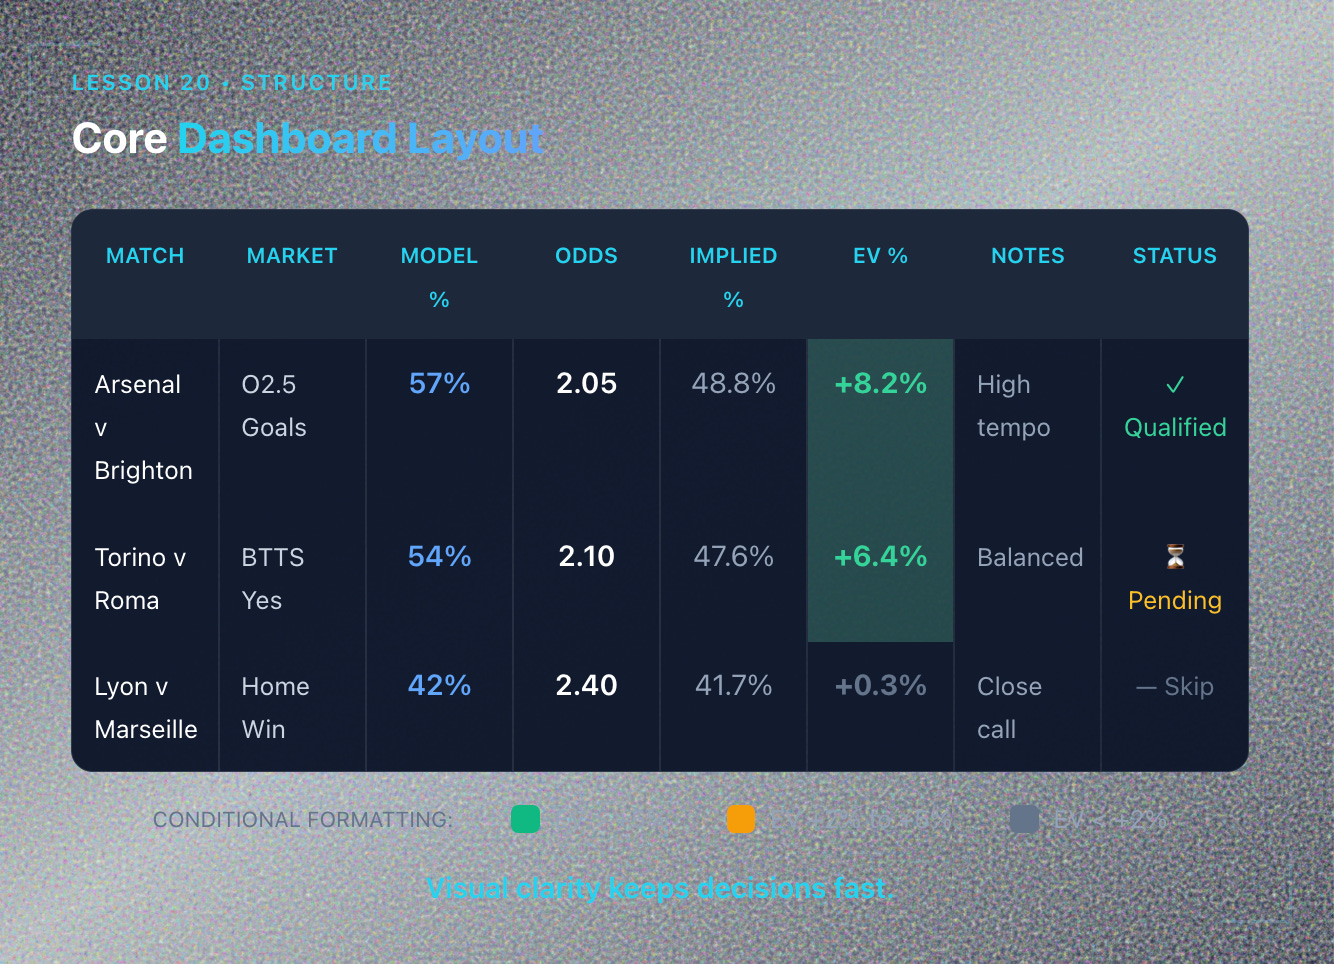
Design your sheet like this:
Match Market Model Prob (%) Odds Implied Prob EV (%) EV (%) xG Notes Bet Status Arsenal v Brighton O2.5 Goals 57 2.05 48.8 +8.2 High tempo ✅ Qualified Torino v Roma BTTS Yes 54 2.10 47.6 +6.4 Balanced –
Conditional formatting can color cells:
Green if EV > +5%
Yellow if EV +2% to +5%
Gray if EV < +2%
Visual clarity keeps decisions fast.
4. Data Input Layer
You have two main options:
Option 1: Manual Entry (Simple Start)
Copy/paste odds from bookmaker sites or aggregators.
Input xG stats from FBref, Understat, or SofaScore.
Update every 30–60 minutes during match day.
Option 2: API Automation (Advanced)
Use free APIs like The Odds API or Football-Data.org.
Set up scripts (Python, Google Apps Script) to pull data automatically.
Refresh every 5–15 minutes.
Start manual. Automate when volume demands it.
5. Building the Model Logic
Your dashboard needs to calculate probabilities for every fixture.
Simple Approach (Sheets Formula):
If you’ve already built a model (Lesson 19), translate it into a formula:
=1/(1+EXP(-(C2*0.4 + D2*0.3 + E2*0.2 + F2*0.1)))
Where:
C2 = Home xG average
D2 = Away xG average
E2 = Rest days differential
F2 = League scoring environment
This returns P(Event) between 0 and 1.
Advanced Approach (Python/R):
Load historical data.
Run logistic regression or Poisson model.
Export probabilities to CSV and import into Sheets.
6. Calculating EV in Real Time
For each bet opportunity:
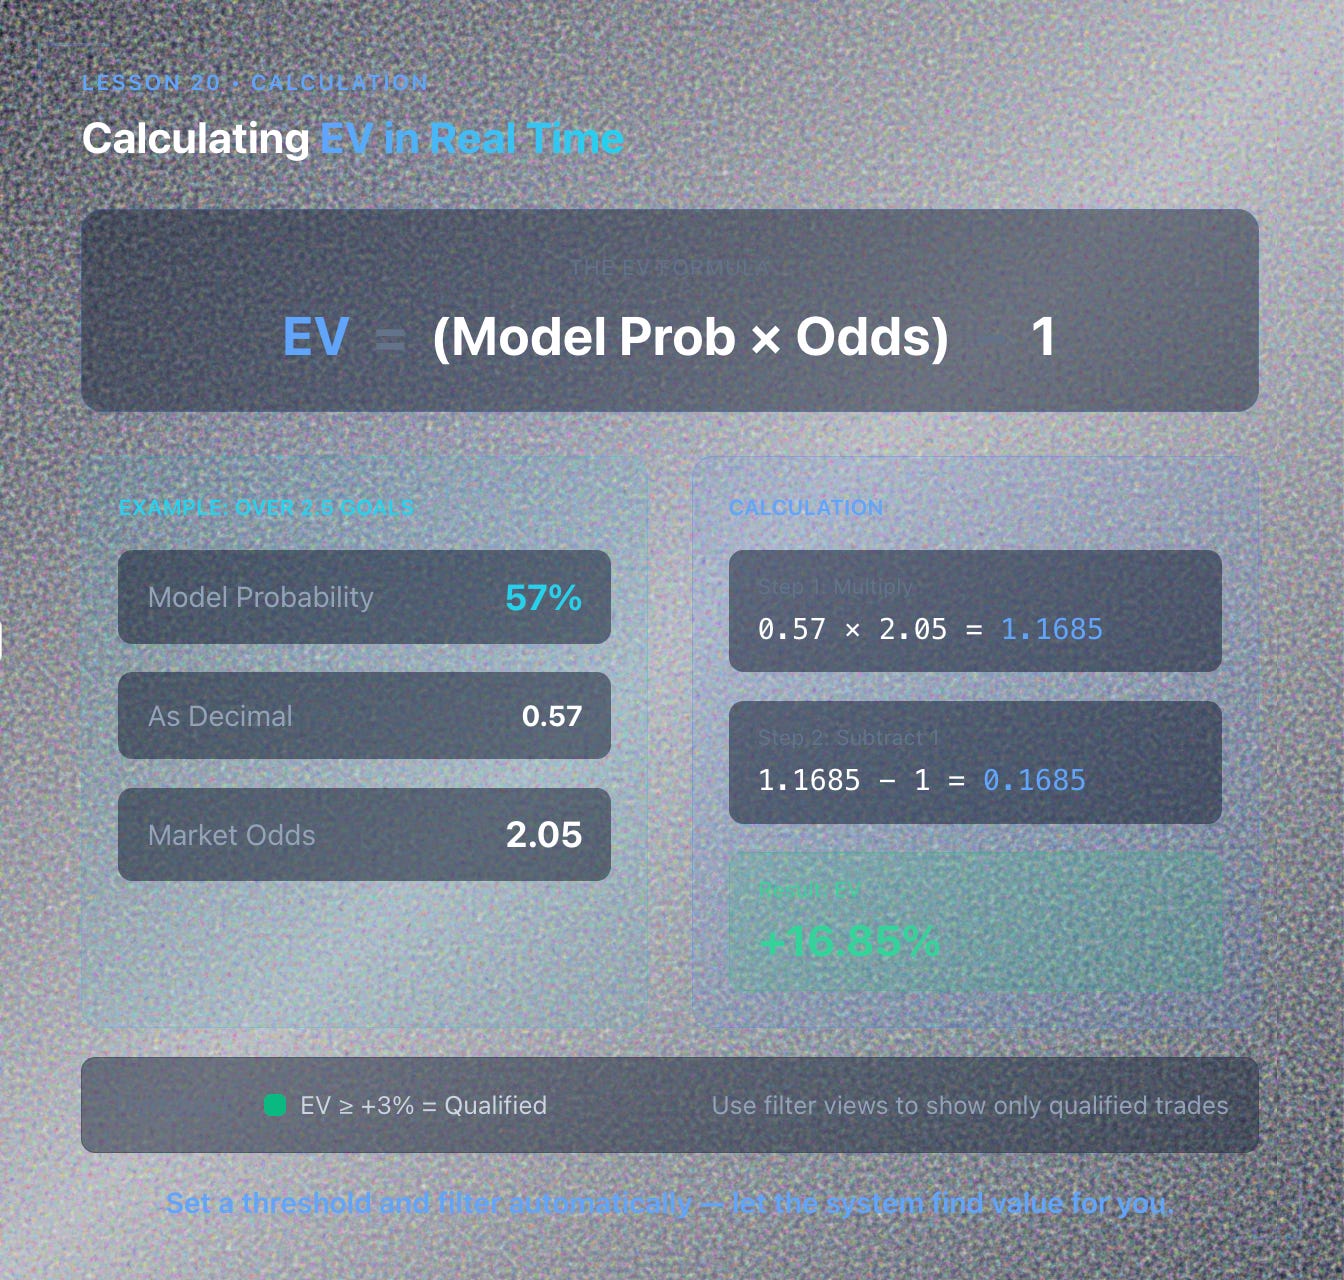
EV = (Model Probability × Odds) - 1
Example:
Model says Over 2.5 Goals = 57% (0.57)
Market odds = 2.05
EV = (0.57 × 2.05) - 1 = 0.1685 = +16.85%
Set a threshold (like EV ≥ +3%) and filter automatically.
Use conditional formatting or filter views to show only qualified trades.
7. Filtering and Alerts
Create filter rules to surface only actionable bets:
EV ≥ +3%
Odds between 1.60 and 3.00 (personal preference)
Liquidity confirmed (check bookmaker limits)
Match starts within next 6 hours
Bonus: Email Alerts Use Google Apps Script to send notifications when new value appears:
function sendAlert() {
  var sheet = SpreadsheetApp.getActiveSheet();
  var data = sheet.getDataRange().getValues();
  // Check for EV > 5%
  // Send email with MailApp.sendEmail()
}
Set this to run every 15 minutes using time-based triggers.
8. Tracking Performance Within the Dashboard
Add a separate “Results” tab to log outcomes:
Date Match Bet Odds Stake Result P/L EV % 2025-11-12 Arsenal v Brighton O2.5 2.05 £50 Win +£52.50 +8.2
Calculate rolling metrics:
ROI: Total P/L ÷ Total Staked × 100
Hit Rate: Wins ÷ Total Bets
Avg EV: Mean of all EV %
CLV: Track closing line vs entry odds
Dashboard becomes both execution and analysis tool.
9. Scaling the System
As your operation grows:
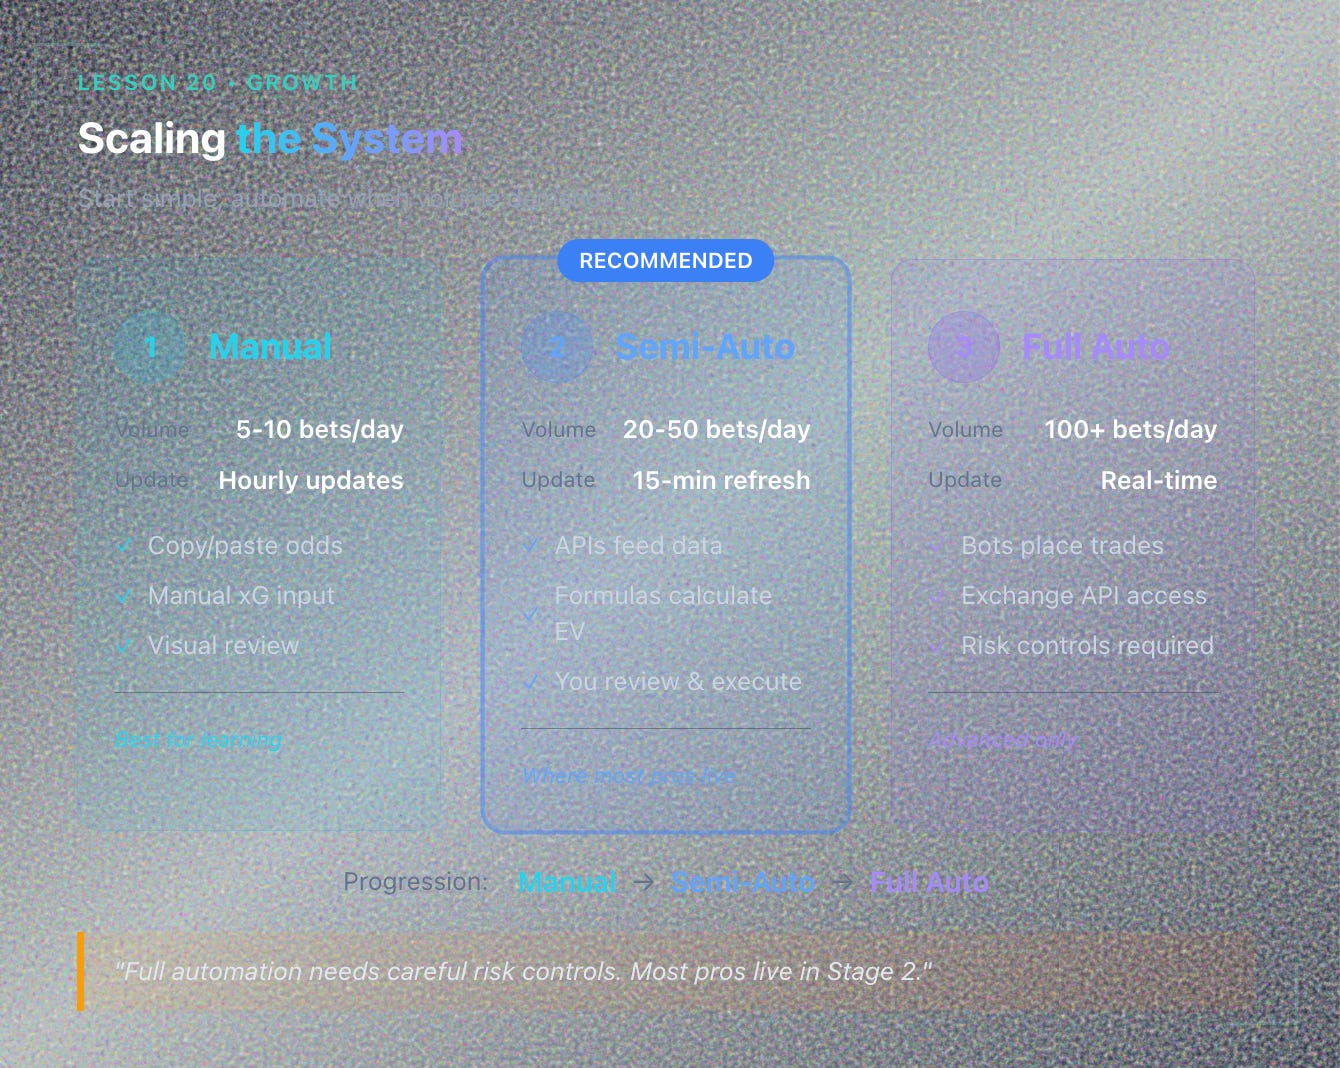
Stage 1 (Manual): 5–10 bets per day, updated hourly.
Stage 2 (Semi-Auto): APIs feed data, formulas calculate EV, you review and execute.
Stage 3 (Full Auto): Bots place qualified trades automatically (requires exchange API access like Betfair).
Most pros live in Stage 2. Full automation needs careful risk controls.
10. Maintaining the Dashboard
Your dashboard is a living system:
Weekly: Audit for accuracy (compare model predictions to results).
Monthly: Refresh historical data feeding your model.
Quarterly: Recalibrate coefficients if market conditions shift.
Annually: Rebuild model with full updated dataset.
A maintained dashboard compounds edge. A neglected one bleeds profit.
Key Takeaways
✅ An EV Dashboard automates the compare step between model and market.
✅ Start simple (Sheets + manual input), automate later (APIs + scripts).
✅ Calculate EV in real time: (Model Prob × Odds) - 1.
✅ Filter for EV ≥ +3% and set alerts for qualified opportunities.
✅ Track performance within the same system for continuous feedback.
✅ Maintain and recalibrate regularly to keep edge sharp.
Final Thoughts
Building an EV Dashboard is the culmination of everything we’ve covered:
Understanding value (Lessons 1–2)
Building models (Lesson 19)
Managing risk (Lessons 4, 14, 15)
Tracking data (Lessons 16, 18)
When these pieces connect, betting stops feeling like guesswork and starts feeling like engineering.
You’re no longer reacting to markets. You’re managing probability.
That’s the professional edge.
Next Lesson
📘 Lesson 21 — From Trader to Analyst: Building Feedback Loops for Continuous Edge
We’ll explore how to use your EV dashboard, journal, and model together to create a living system that constantly learns from results, adapts to variance, and sharpens your edge over time.