

From Trader to Analyst: Building Feedback Loops for Continuous Edge
Betting Knowledge - Lesson 21

Betting Knowledge Series: Lesson 21
From Trader to Analyst: Building Feedback Loops for Continuous Edge
Most bettors stop growing once they’ve built something that works. They get comfortable. I think that’s the mistake, really. Markets shift. Models age. Human behaviour mutates quietly. Without structured feedback, even systems that looked brilliant two months ago can rot from the inside. You won’t notice the decay until you’re already losing.
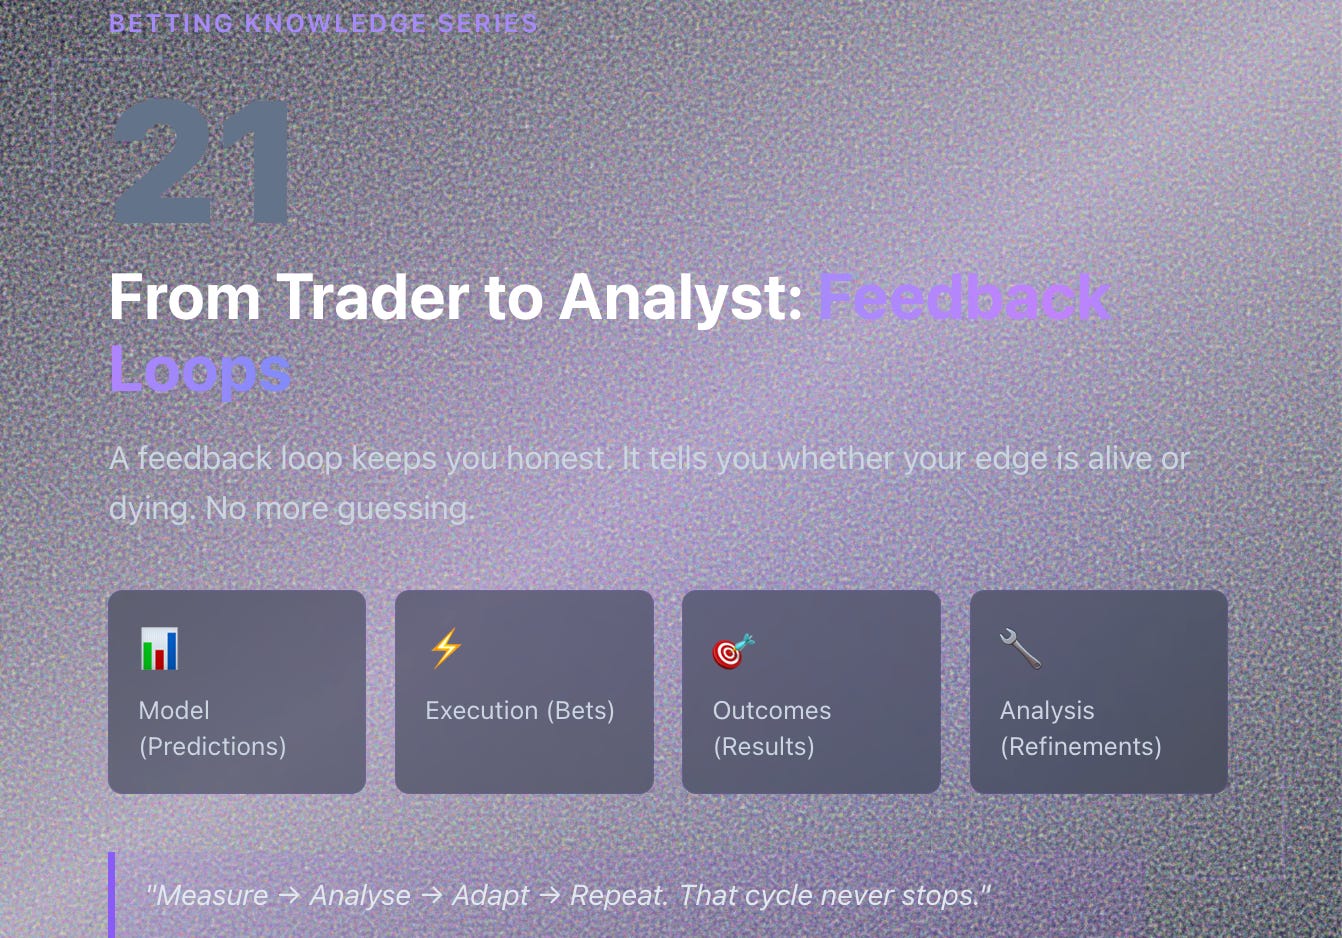
A feedback loop keeps you honest. It tells you whether your edge is alive or dying. No more guessing.
What a Feedback Loop Actually Is
At its core: measure results, learn from them, adjust inputs. In betting terms, that means connecting four pieces:
Your model (predictions)
Your execution (bets placed)
Your outcomes (results)
Your analysis (refinements)
When these talk to each other, your system becomes something alive. Self-correcting. Always moving toward better accuracy and tighter efficiency.
The Four-Stage Loop
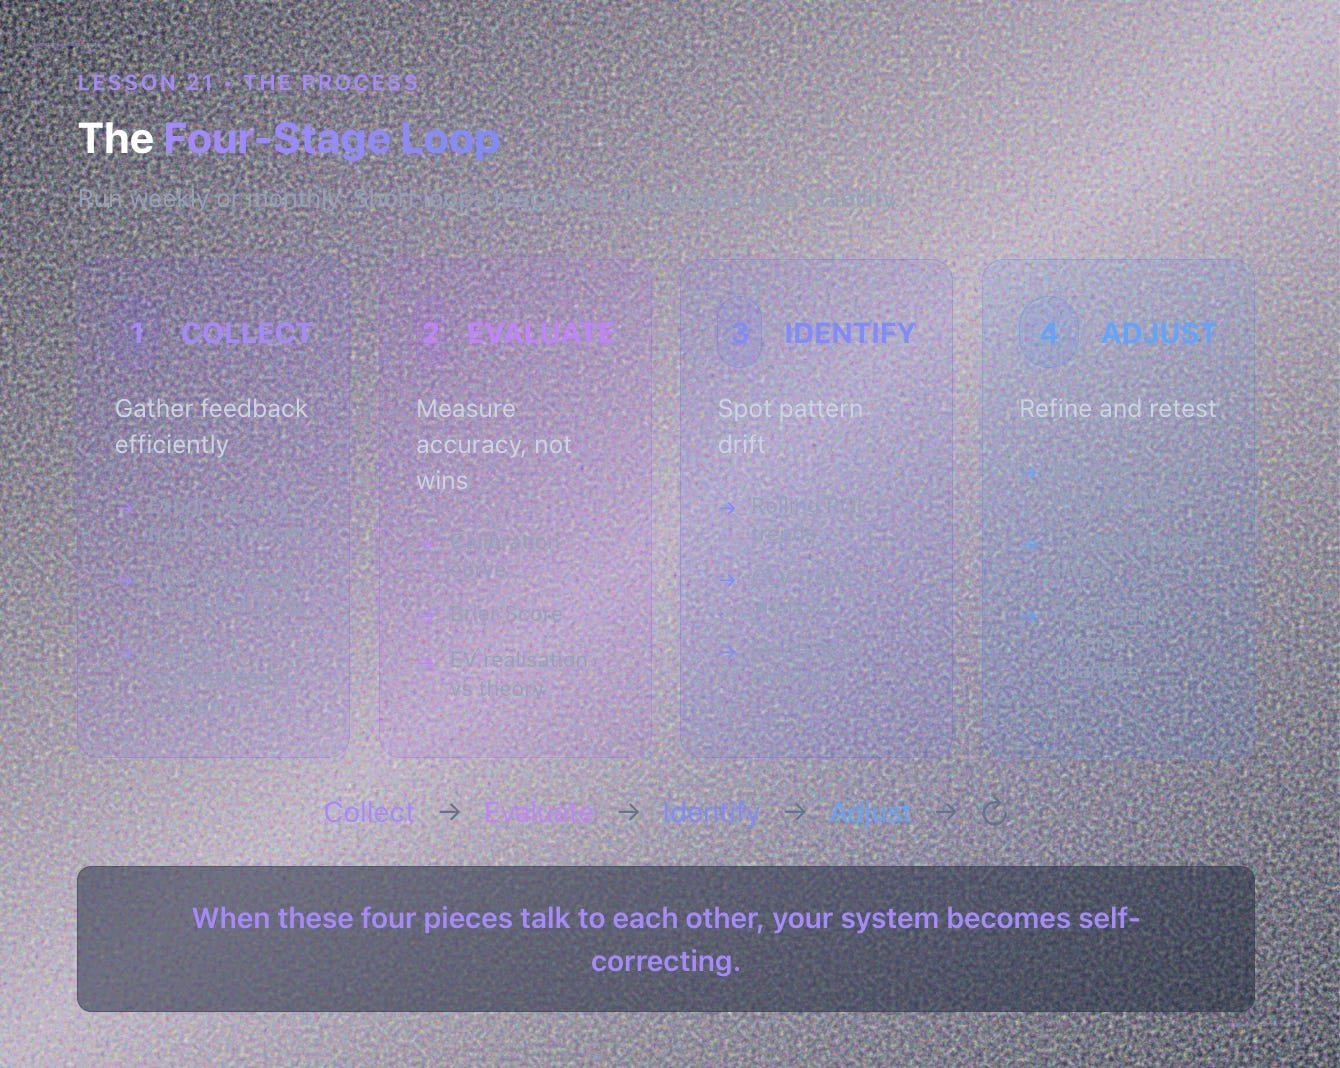
Run this weekly or monthly, depending on volume. Short loops teach you fast. Long loops give stability. You need both. Small corrections inside long-term consistency.
Step 1: Collect Feedback Efficiently
You’ve already got two engines running:
Your journal (Lesson 16)
Your EV dashboard (Lesson 20)
Use them together. Export results automatically from the dashboard to your journal. Add columns for predicted probability, implied probability, outcome (1 or 0). Tag each bet by system or model version. This structure lets you compare expectation against reality in seconds.
Step 2: Evaluate Accuracy
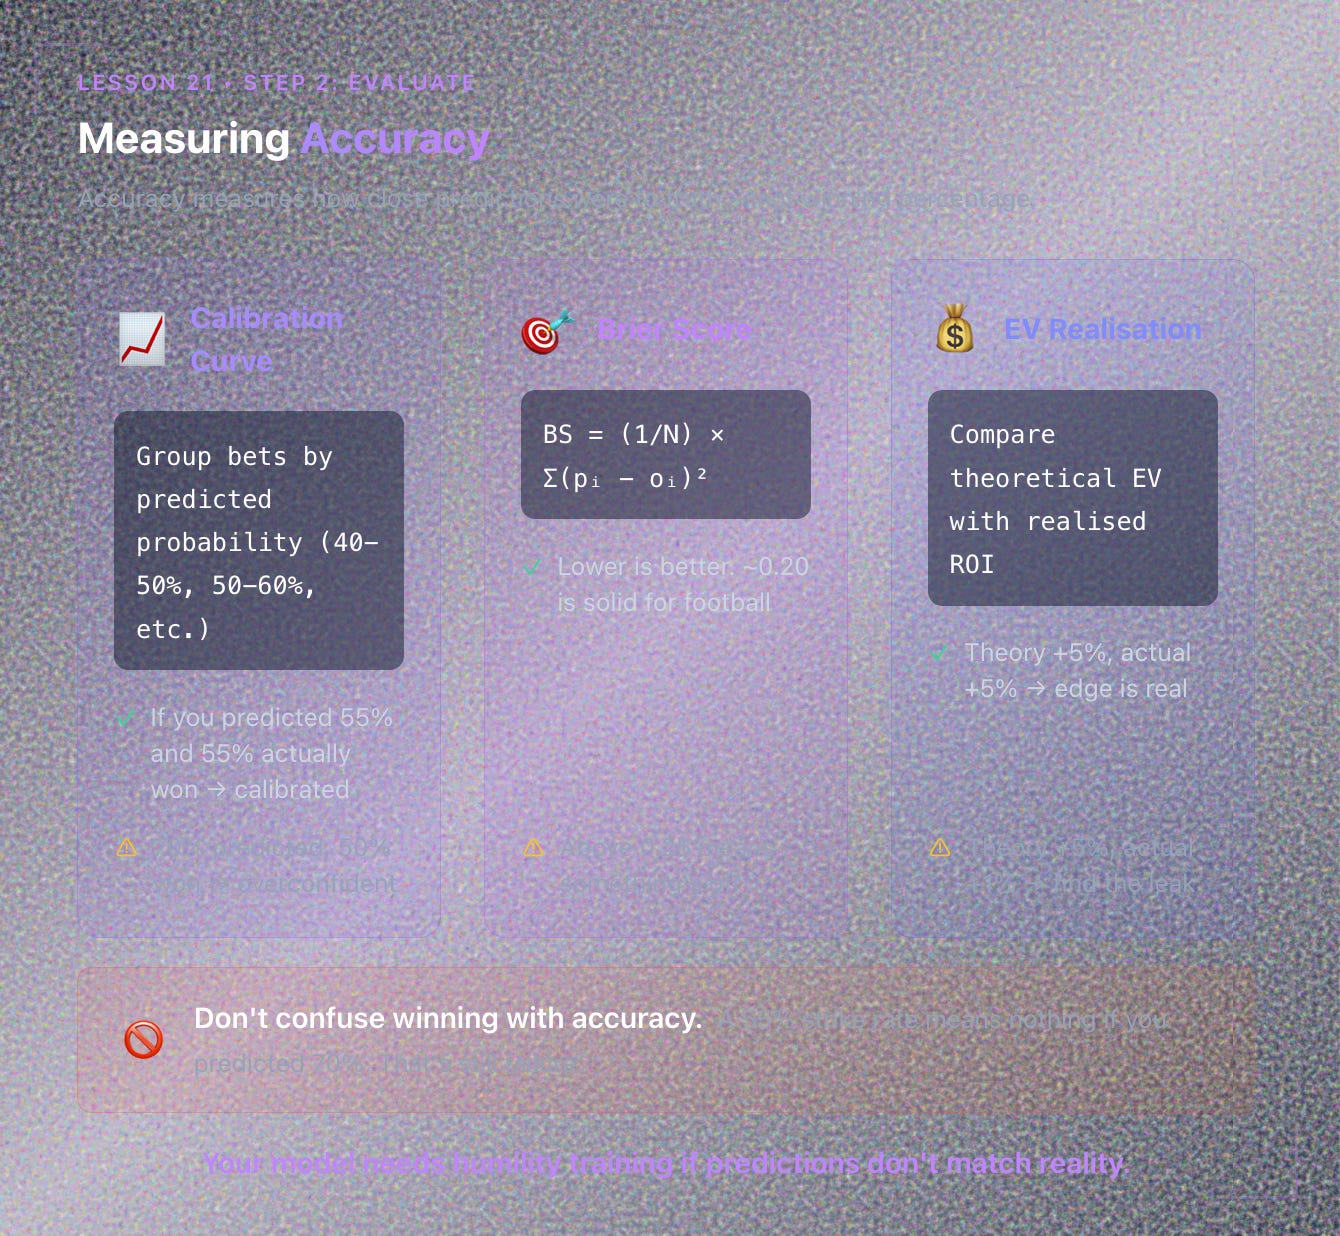
Accuracy measures how close your predictions were to truth, not winning percentage. That’s amateur thinking.
Calibration Curve
Group bets by predicted probability. Say, 40–50%, then 50–60%, and so on. If you predicted 55% and 55% actually won, you’re calibrated. If you predicted 70% and only 50% won, you’re overconfident. Your model needs humility training.
Brier Score
BS = (1/N) × Σ(p_i - o_i)²
Lower is better. Around 0.20 is solid for football markets. Above 0.25 means something’s off.
EV Realisation
Compare theoretical EV with realised ROI. If theory says +5% and you’re getting +1%, something’s eating your edge. Variance, commission, timing: find the leak.
Step 3: Identify Pattern Drift
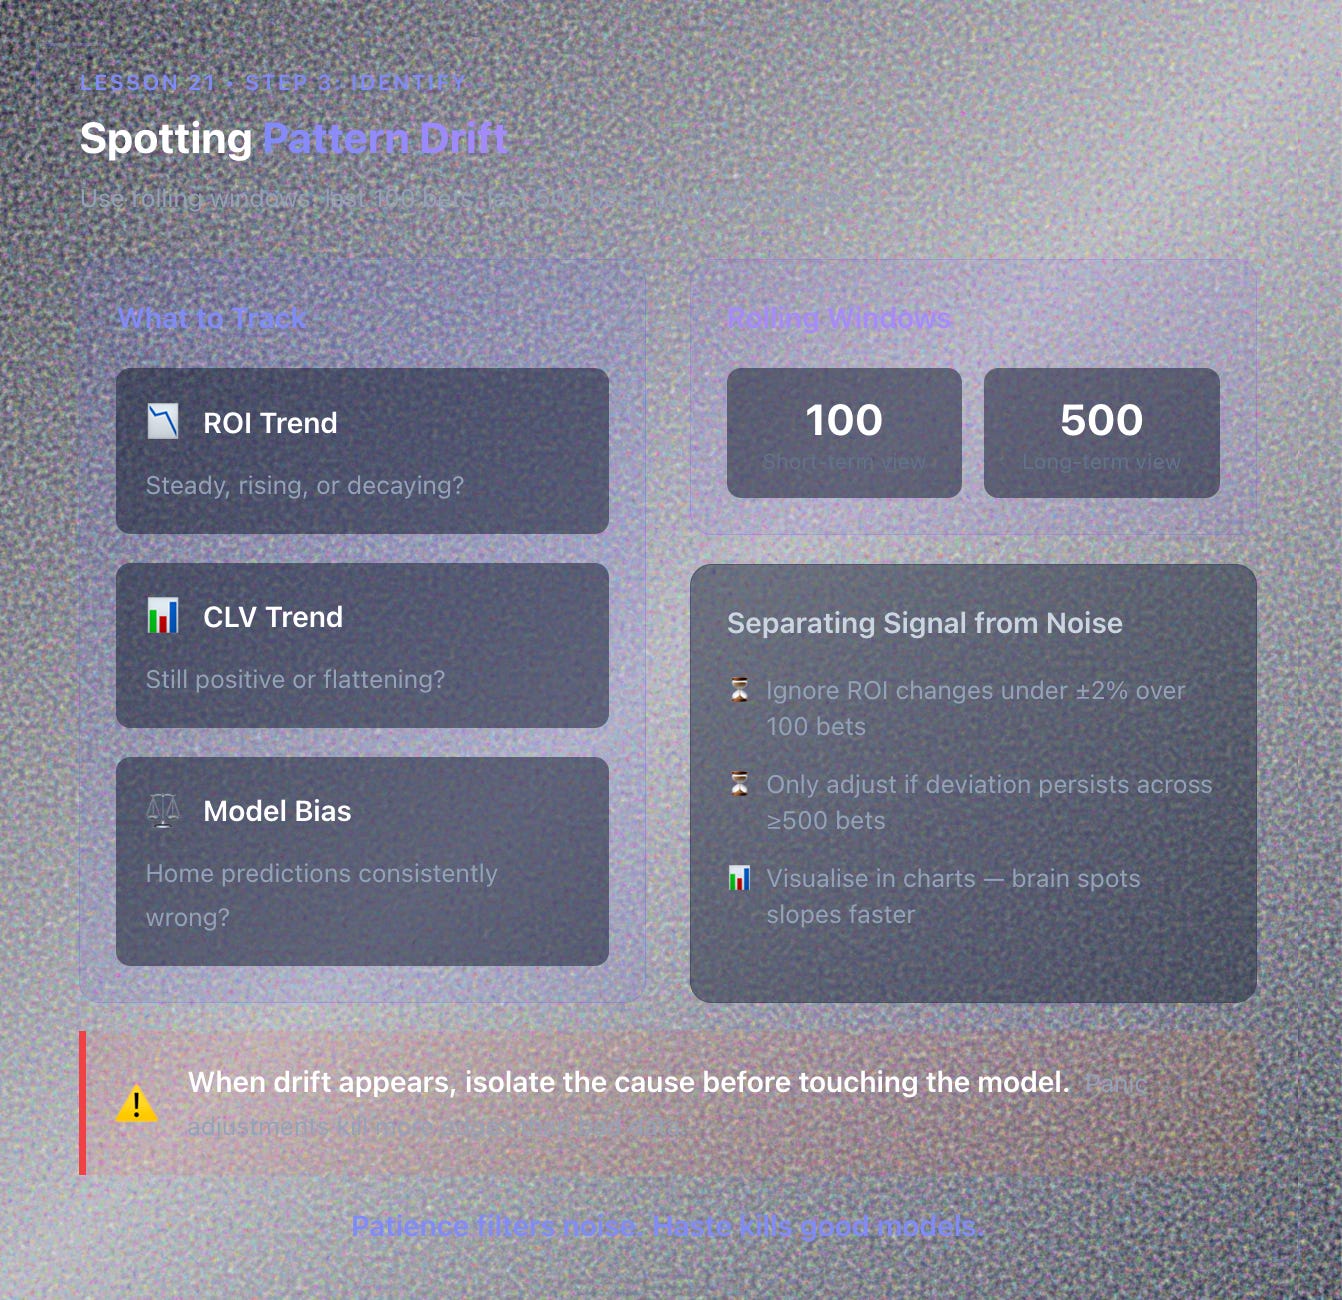
Use rolling windows. Last 100 bets, last 500 bets. Look for:
ROI trend: steady, rising, or decaying?
CLV trend: still positive or flattening?
Model bias: are home predictions consistently wrong? Away bets losing more than they should?
Visualise these in charts. The human brain spots slope changes faster than numbers. When drift appears, isolate the cause before touching the model. Panic adjustments kill more edges than bad data.
Step 4: Adjust and Retest
After diagnosing drift:
If miscalibration: rescale probabilities (compress extremes)
If poor markets: tighten filters (exclude noisy leagues)
If timing issue: execute earlier or later to beat closing line
Re-run a back-test or forward-test on the adjusted version (Lesson 17). Document the change in your version log:
“Model v1.3: Added tempo index; removed rest-day variable.”
Incremental evolution prevents confusion later. You’ll thank yourself when you’re looking back at Version 2.8 trying to remember what changed.
Separate Signal from Noise
Not every fluctuation means something. Build tolerance thresholds:
Ignore ROI changes under ±2% over 100 bets
Only adjust if deviation persists across ≥500 bets
Patience filters noise. Haste kills good models. Feedback loops are about evidence-based tweaks, not panic reactions.
Create Meta-Metrics
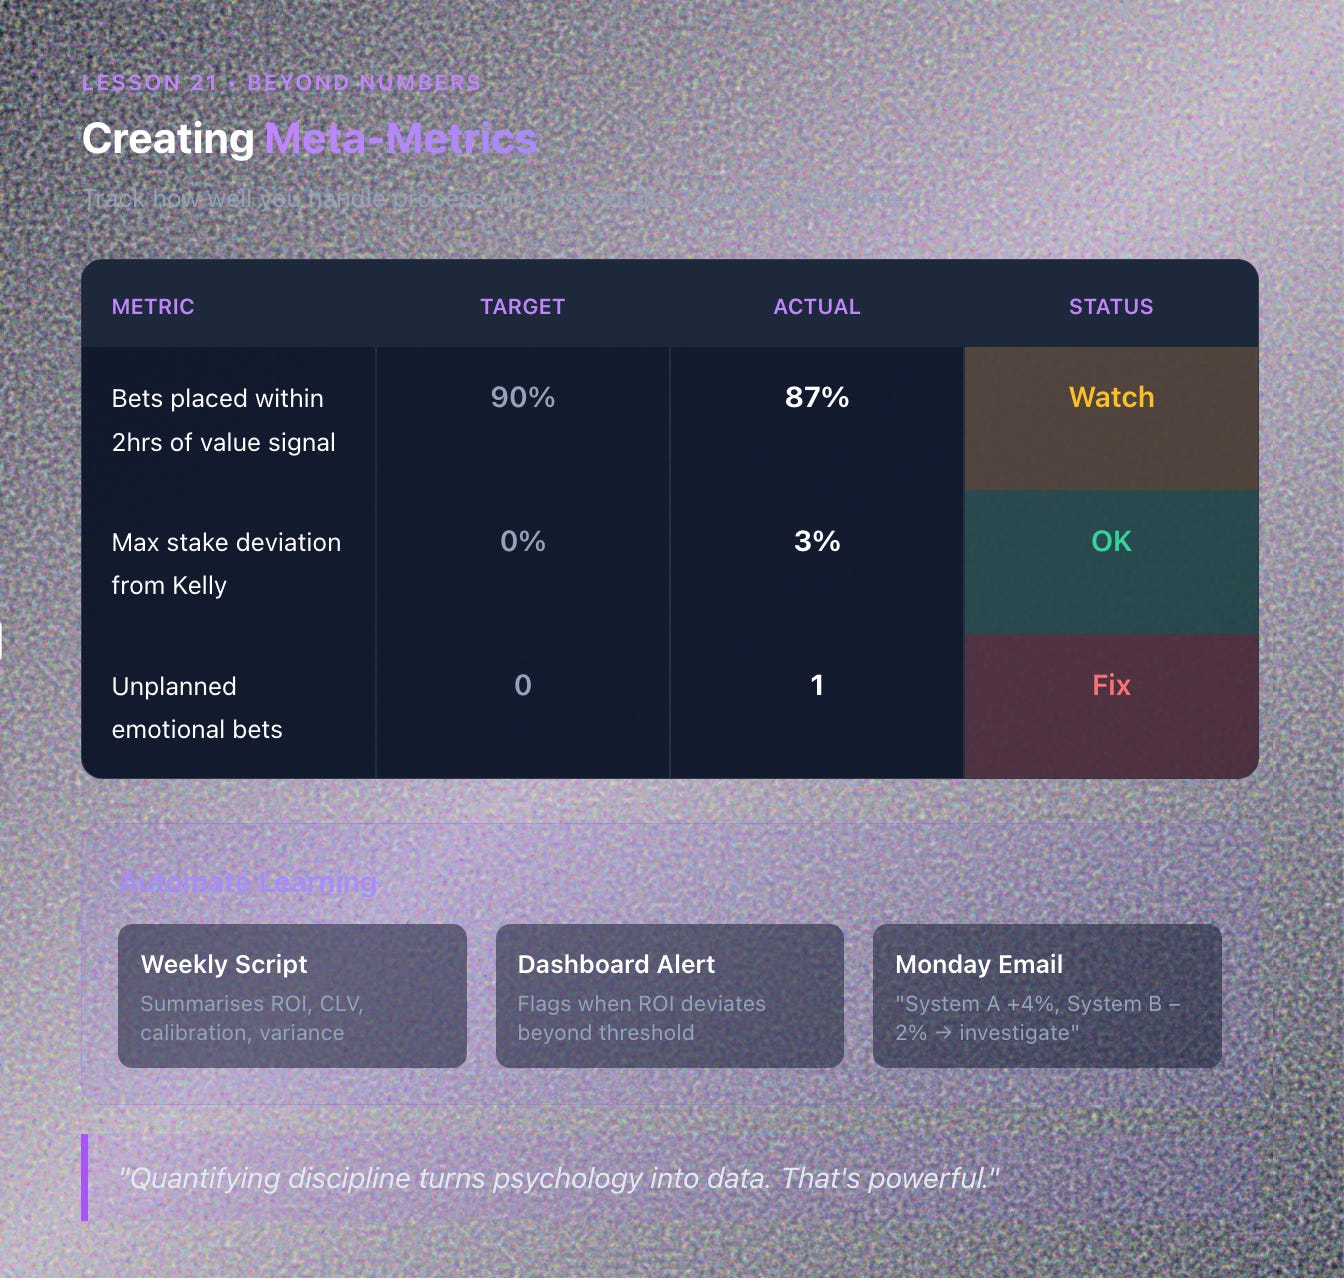
Track how well you handle process, not just numbers. For example:
Metric Target Actual Status Bets placed within 2hrs of value signal 90% 87% Watch Max stake deviation from Kelly 0% 3% OK Unplanned emotional bets 0 1 Fix
Quantifying discipline turns psychology into data. That’s powerful.
Automate Learning
Simple automation ideas:
Weekly script that summarises ROI, CLV, calibration, variance
Dashboard chart that flags when ROI deviates beyond threshold
Email report every Monday: “System A +4%, System B –2% → investigate”
Automation closes the loop faster than human willpower. Think of it like having a coach who reviews your performance after every match. Except this coach never sleeps and doesn’t care about your feelings.
The Professional Feedback Culture
Elite traders treat feedback like oxygen. They don’t fear being wrong. They fear not knowing why. Their mantra:
“Measure → Analyse → Adapt → Repeat.”
That cycle never stops. Each loop adds precision, resilience, calm. When improvement is built into your process, emotion has no seat at the table.
Key Takeaways
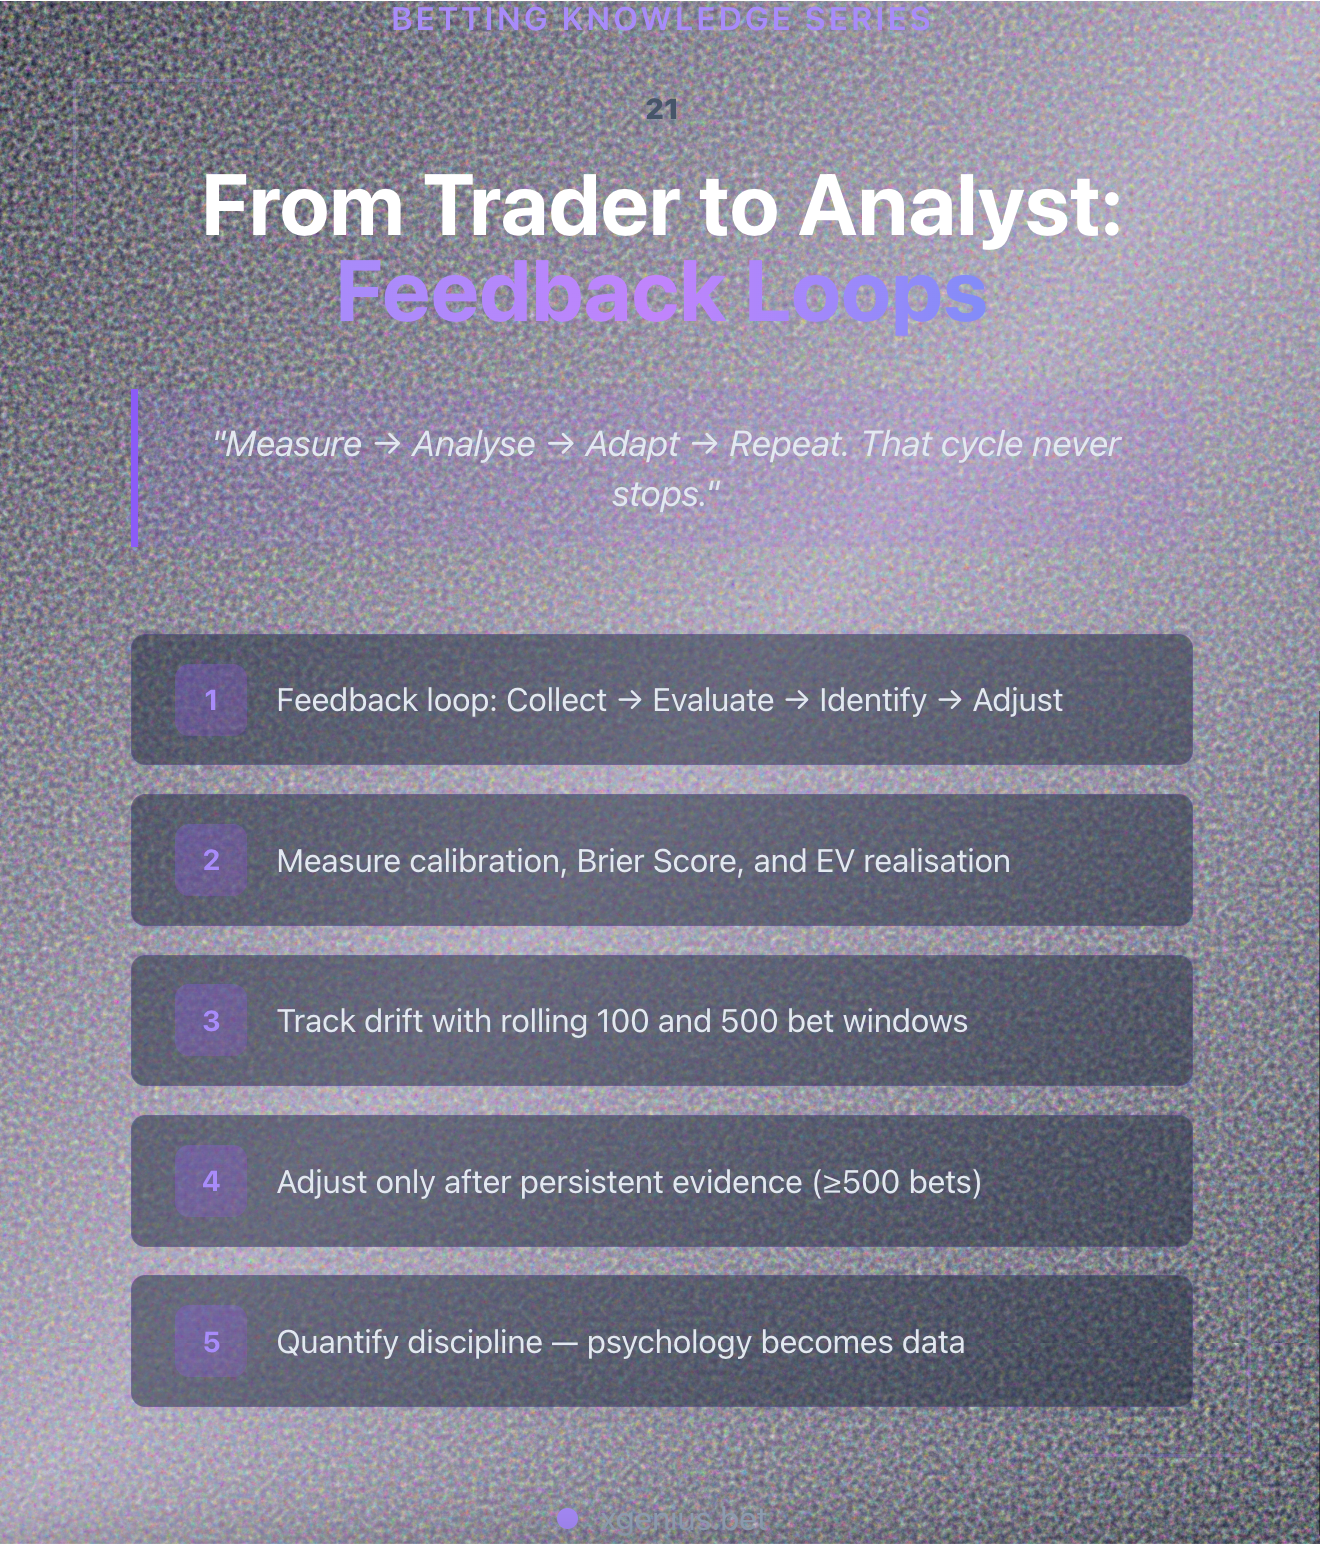
A feedback loop turns your betting process into a self-improving system. Measure expectation against reality through calibration, Brier Score, and EV realisation. Track drift with rolling ROI and CLV trends. Adjust only after persistent evidence. Quantify behaviour. Discipline is a metric too. Automate reports so learning happens every week, not when you remember to check.
Next Lesson
Lesson 22: Scaling Up: How to Increase Volume and Profit Without Breaking Discipline
We’ll cover how professionals scale their operation safely: raising stakes, expanding systems, increasing turnover while keeping risk, emotion, and variance firmly under control.