


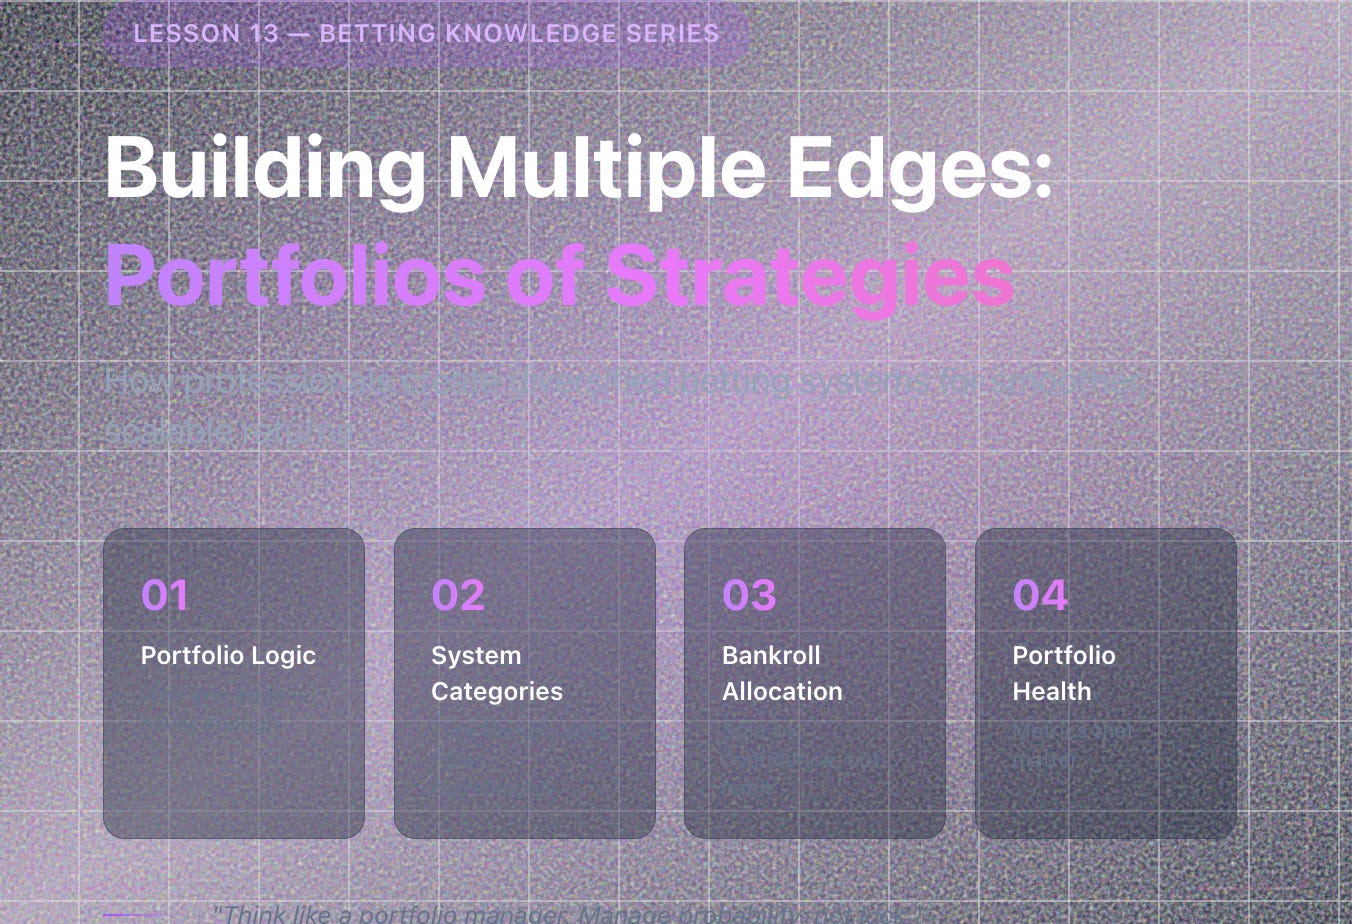
Betting Knowledge Series — Lesson 13
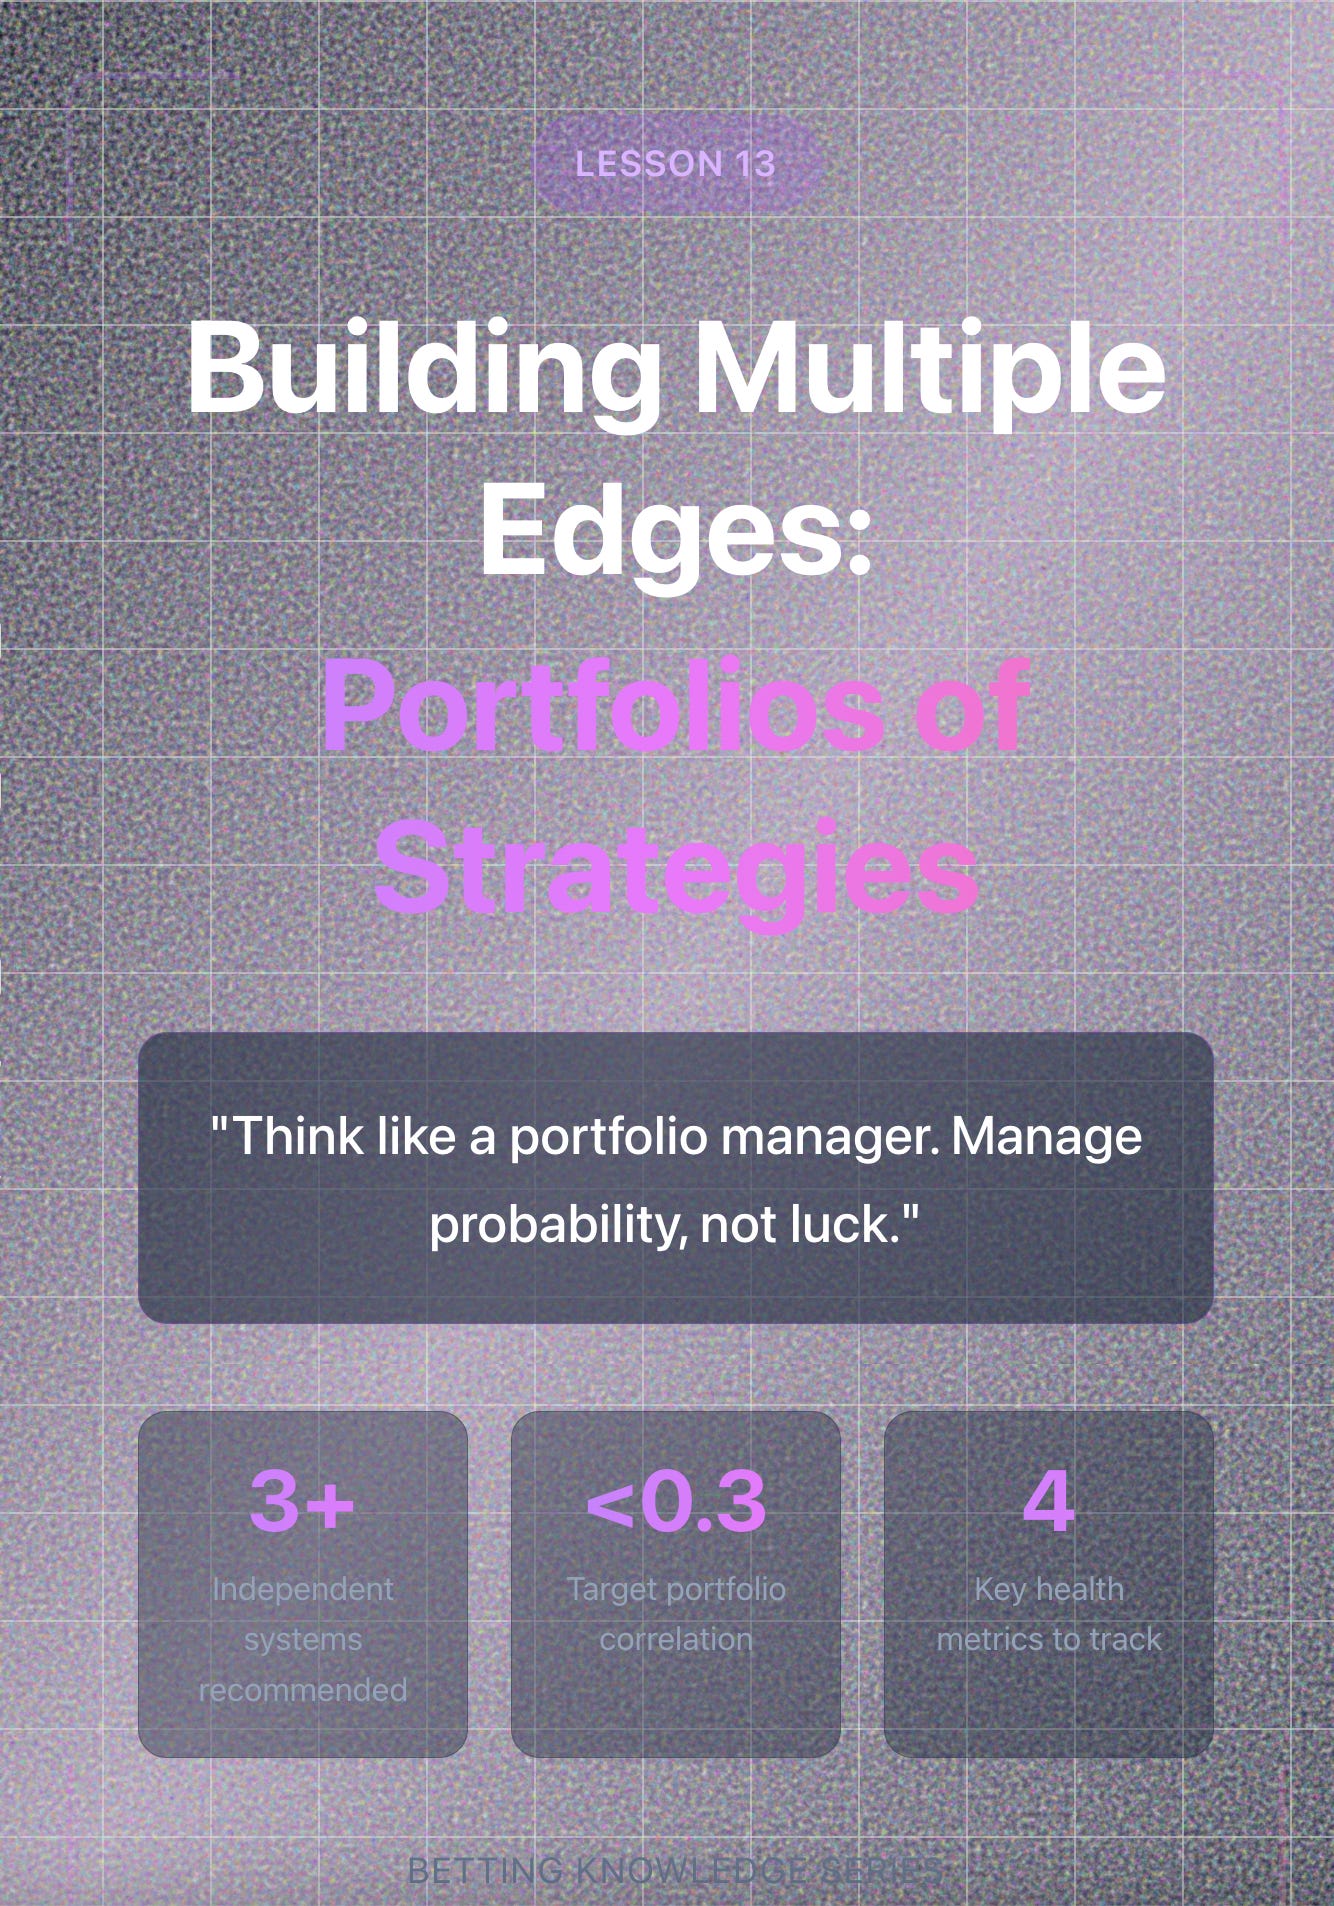
How Professionals Build Portfolios of Strategies
Introduction
One of the biggest myths in betting is that you only need one great strategy.
In truth, every system has weaknesses: variance, seasonality, liquidity, or market exposure.
Professionals offset those weaknesses by building portfolios. Groups of independent edges that complement each other.
Just as investors balance stocks and bonds, elite bettors balance different types of bets, timeframes, and risk profiles.
This lesson explains how to design, test, and manage your own portfolio of betting systems for smoother, scalable returns.
1. Why One Edge Is Never Enough
Even a strong system experiences brutal downswings.
If 100% of your exposure sits in one logic, one data feed, or one league, you’re over-concentrated.
The goal of a portfolio isn’t to chase more profit. It’s to reduce volatility.
By combining uncorrelated systems (those that don’t rise and fall together), you flatten drawdowns and stabilize growth.
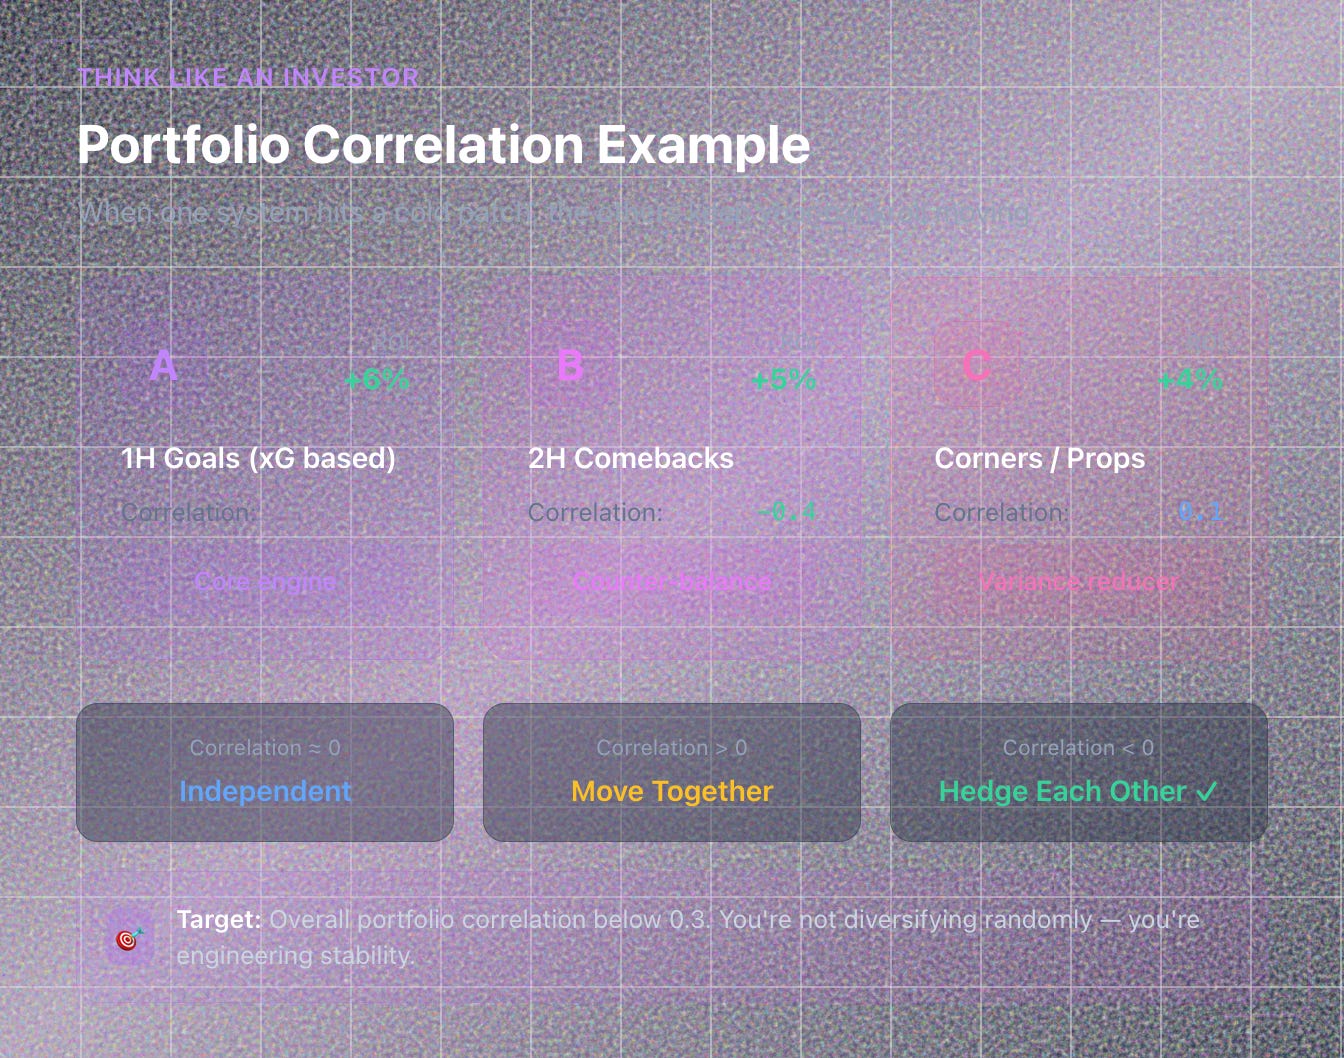
2. Think Like an Investor
Borrow a concept from portfolio theory: correlation.
If System A wins when System B loses, together they smooth your curve.
Example:
System Market Typical ROI Correlation Role A 1H Goals (xG based) +6% — Core engine B 2H Comebacks +5% Negative (-0.4) Counter-balance C Corners / Props +4% Low (0.1) Variance reducer
When one system hits a cold patch, the others keep your bankroll moving.
You’re not diversifying randomly. You’re engineering stability.
3. Categorizing Systems by Timeframe
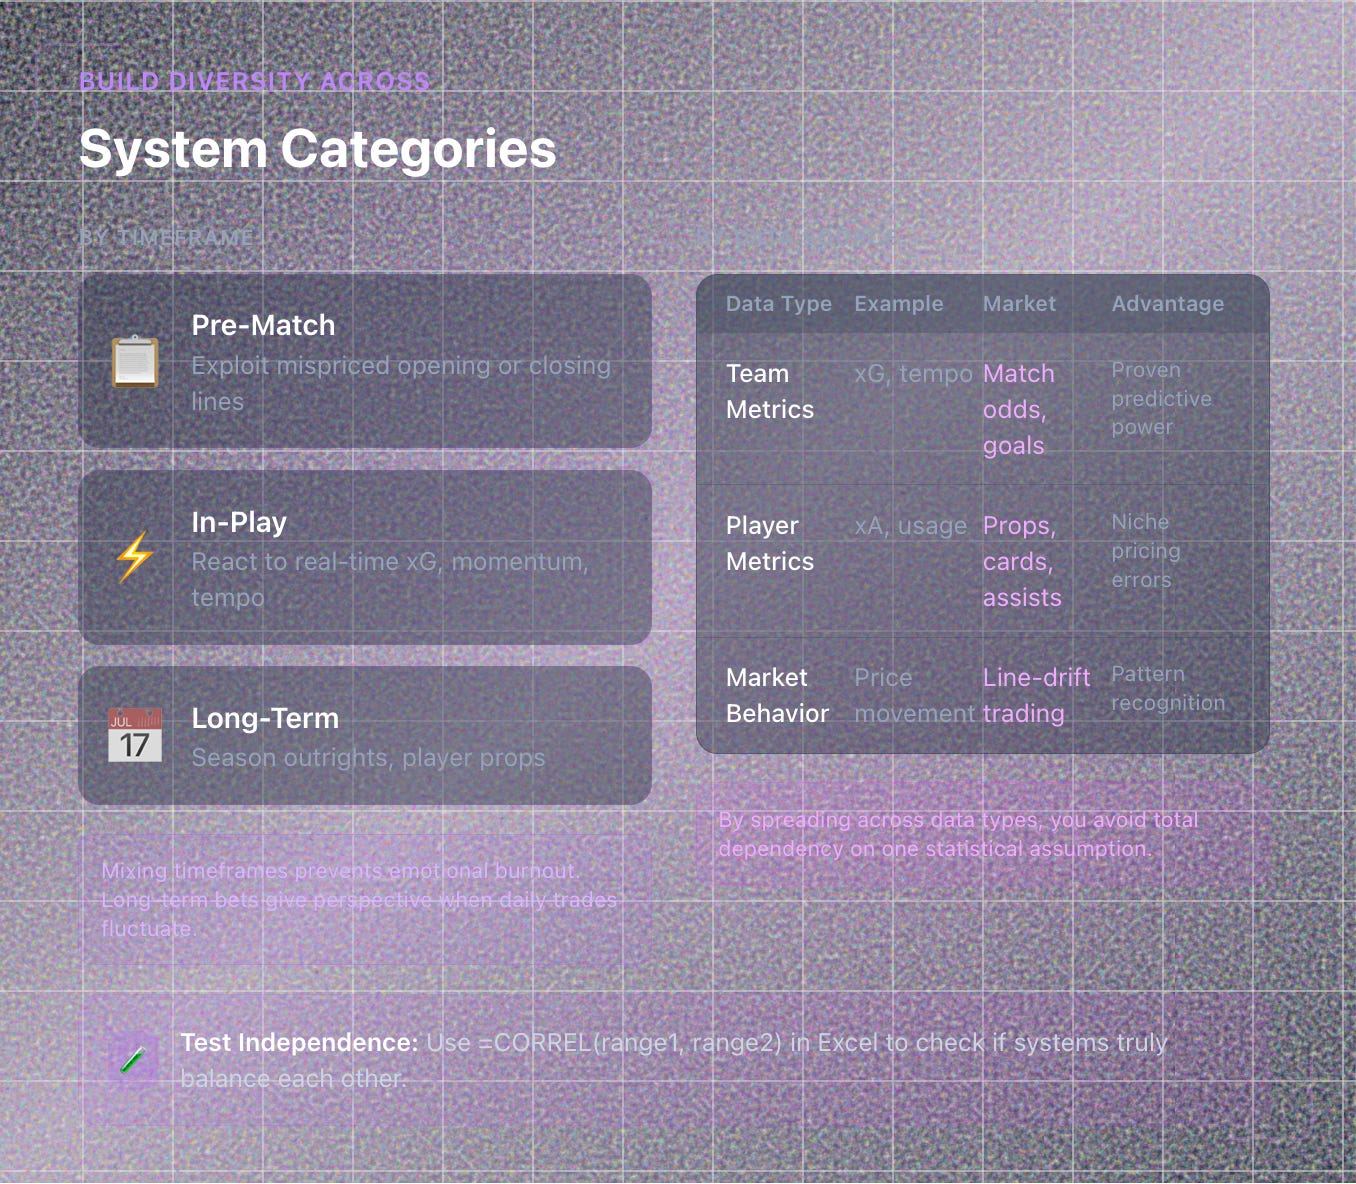
A simple way to build diversity is across time horizons:
Pre-match models: Exploit mispriced opening or closing lines.
In-play models: React to real-time metrics like xG, momentum, and tempo.
Long-term markets: Season outrights or player props that hedge weekly volatility.
Mixing timeframes prevents emotional burnout. Your long-term bets give perspective when daily trades fluctuate.
4. Categorizing by Data Source
Different systems rely on different data strengths:
Data Type Example Market Advantage Team metrics (xG, tempo) Match odds, goals Proven predictive power Player metrics (xA, usage) Props, cards, assists Niche pricing errors Market behavior (price movement) Line-drift trading Pattern recognition
By spreading across data types, you avoid total dependency on one statistical assumption.
5. Testing for Independence
To know whether systems truly balance each other, track their correlation coefficient.
Use this simple Excel formula: =CORREL(range1, range2) where ranges are profit sequences per system.
A correlation near 0 = independent.
Positive = move together (not ideal).
Negative = hedge each other (great).
Aim for an overall portfolio correlation below 0.3.
6. Allocating Bankroll Across Systems
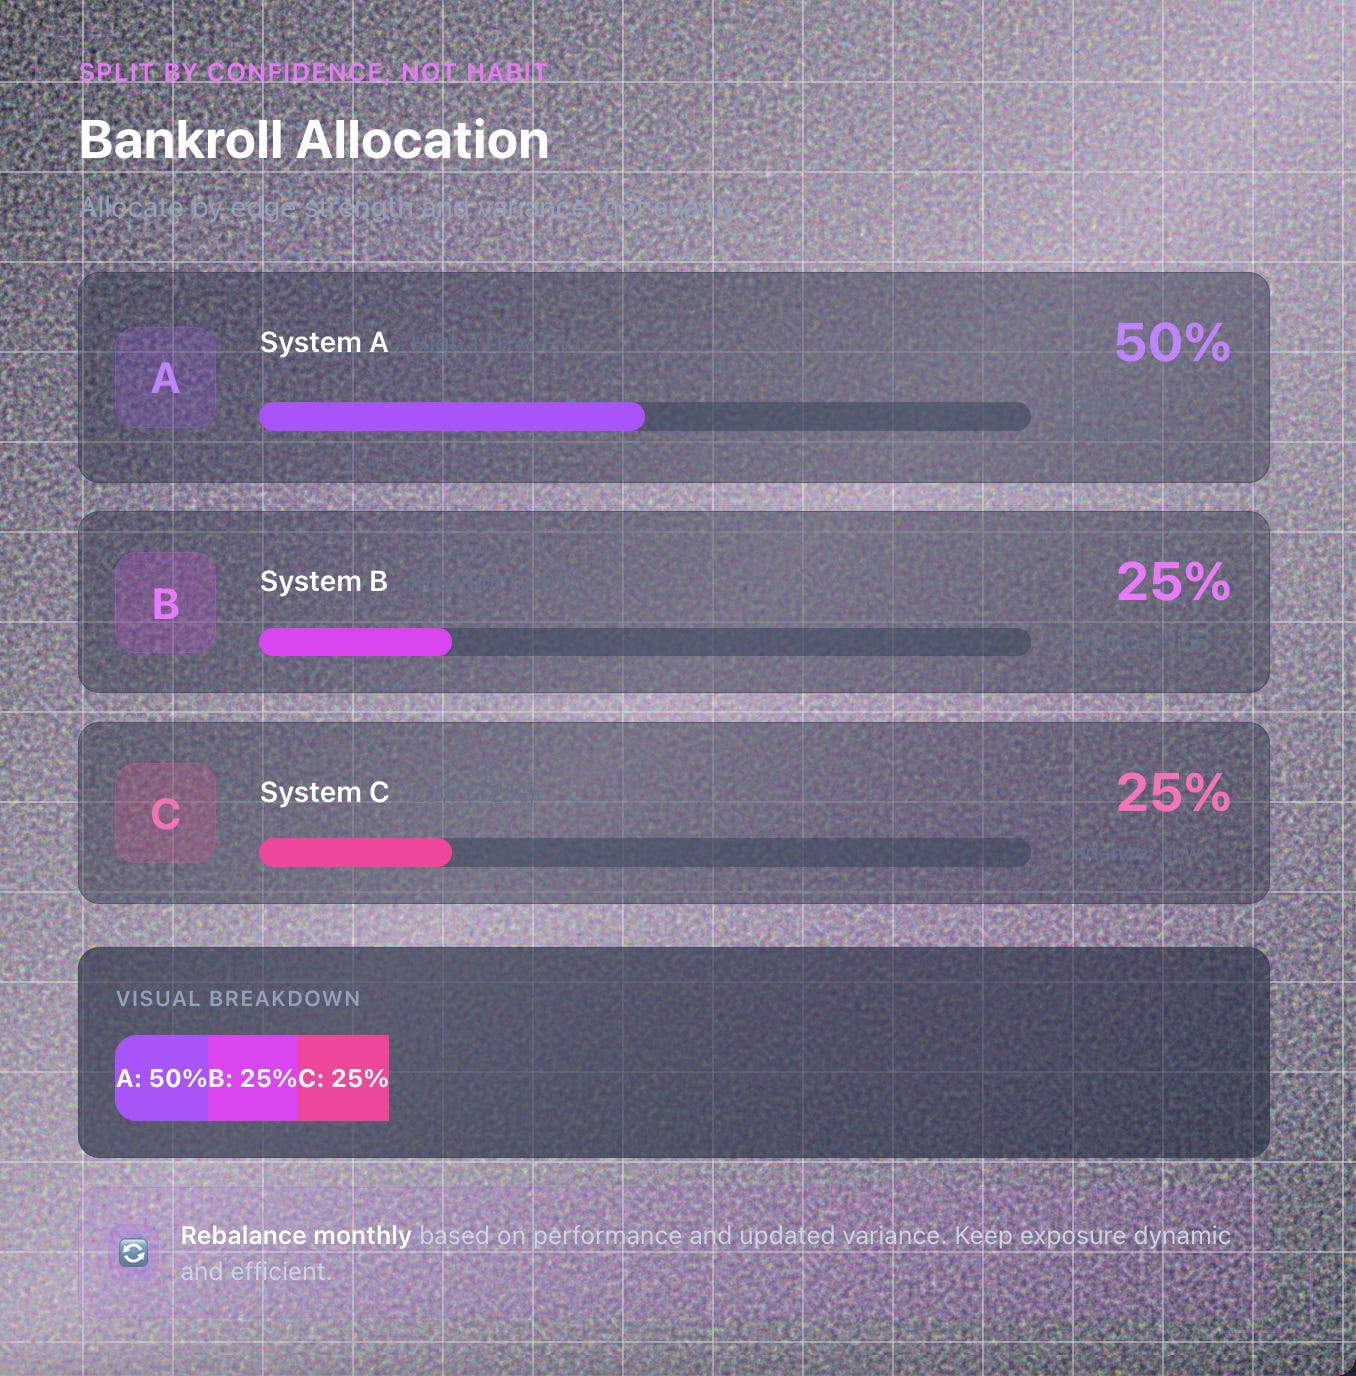
Don’t split your bankroll evenly by habit. Split it by confidence and correlation.
Example:
System Edge Strength Variance Bank % A High (+6% EV) Moderate 50% B Medium (+4%) High 25% C Low (+2%) Low 25%
Rebalance monthly based on performance and updated variance.
This keeps exposure dynamic and efficient.
7. Monitoring Portfolio Health
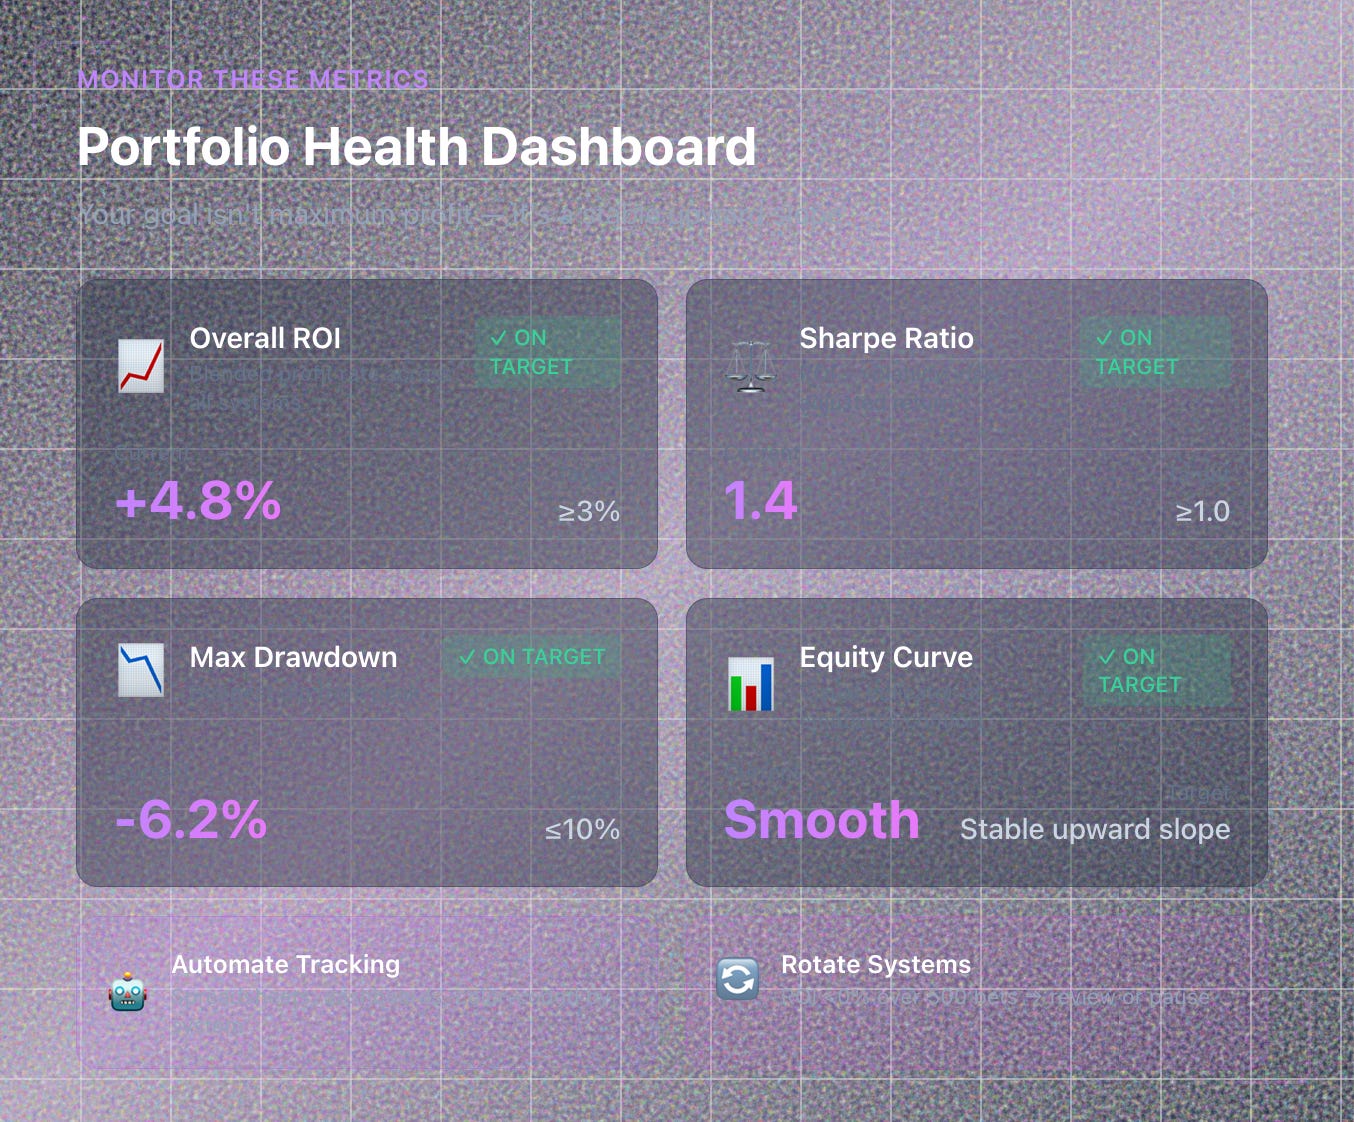
Judge your portfolio by these metrics:
Overall ROI: Blended profit rate across all systems.
Sharpe Ratio: ROI ÷ volatility; measures risk-adjusted return.
Max Drawdown: Deepest dip from peak.
Equity Curve Smoothness: Visual indicator of emotional comfort.
Your goal isn’t maximum profit. It’s a stable upward slope that you sustain mentally and financially.
8. Automate Where Possible
Running multiple systems gets messy.
Automation keeps everything disciplined:
Use spreadsheets or dashboards to log results separately.
Color-code by system for instant performance snapshots.
Create alerts or APIs to trigger bets only when filters align.
Automation doesn’t replace insight. It preserves consistency.
9. Rotating and Retiring Systems
Each system has its own life cycle (see Lesson 12).
Set objective criteria for rotation:
ROI < 0% over 500 bets → review or pause.
CLV trend neutral for 3 months → re-evaluate.
Edge validation tests fail twice → retire.
Retiring systems frees time and capital for new ideas.
A lean, evolving portfolio always outperforms a cluttered one.
10. The Portfolio Mindset
Stop thinking of yourself as “a bettor with a strategy.”
Think of yourself as a portfolio manager of probabilities.
Each system is a mini-investment vehicle.
Your role is to:
Allocate capital where EV × discipline = highest utility.
Rebalance regularly.
Measure risk and correlation.
Keep data flowing through your feedback loop.
When you reach this mindset, you stop living and dying by individual results. Your business becomes statistical compounding.
Key Takeaways
✅ One edge = fragile; multiple independent edges = resilient.
✅ Balance systems across timeframes, data types, and correlations.
✅ Allocate bankroll by confidence and variance, not evenly.
✅ Track portfolio health (ROI, drawdown, Sharpe ratio).
✅ Automate tracking and rotate underperforming systems.
✅ Think like a portfolio manager. Manage probability, not luck.
Next Lesson
📘 Lesson 14: Understanding Correlation, Covariance & Risk Management Across Markets
We’ll take the portfolio idea deeper, explaining how to measure overlap between bets, avoid doubling risk unintentionally, and calculate true exposure when trading multiple correlated markets.