


Betting Knowledge Series — Lesson 18
How to Build Your Own Betting Database
Introduction
Every successful bettor eventually hits the same wall: limited access to clean, consistent data.
Public sites give you fragments: a few seasons of xG here, some shot maps there.
To model value properly, you need your own organized record of reality.
Public sites give you fragments: a few seasons of xG here, some shot maps there.
To model value properly, you need your own organized record of reality.
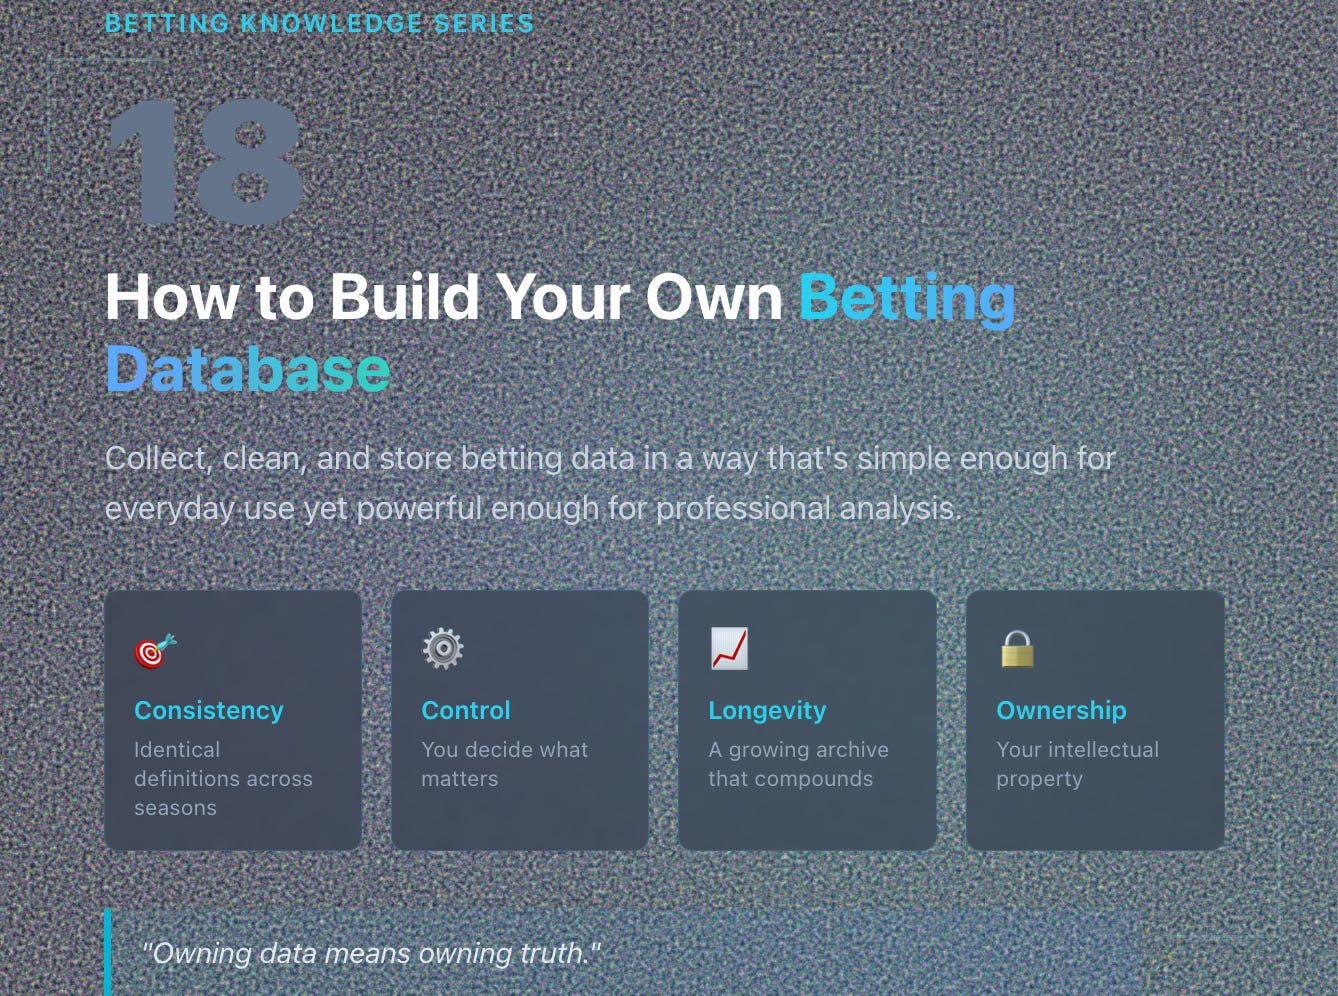
This lesson shows you how to collect, clean, and store betting data in a way that’s simple enough for everyday use yet powerful enough for professional analysis.
1. Why You Need Your Own Data
Owning data means owning truth.
When you rely on public sources:
Definitions differ (one site’s “big chance” isn’t another’s).
Records vanish or change after updates.
You can’t test new ideas historically.
A personal database gives you:
✅ Consistency: Identical definitions across seasons.
✅ Control: You decide what matters.
✅ Longevity: A growing archive that compounds value.
Data is your intellectual property. Treat it like an asset.
2. Start Small, Stay Structured
You don’t need SQL servers or coding skills to start.
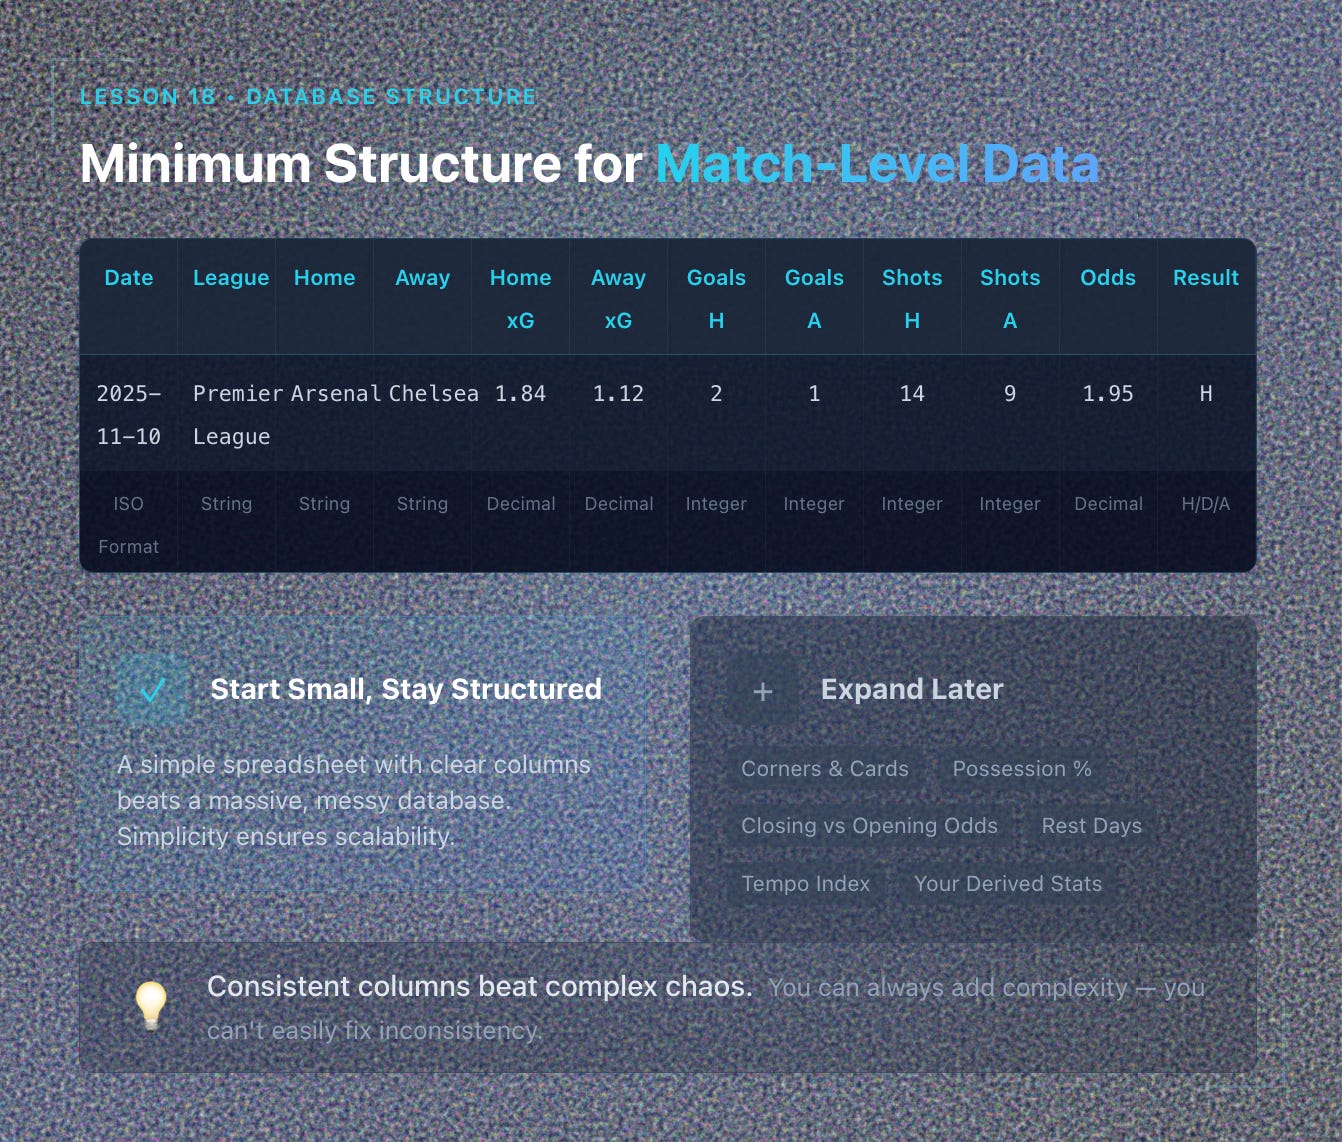
A simple spreadsheet with clear columns beats a massive, messy database.
Minimum structure for match-level data:
Date League Home Away Home xG Away xG Goals H Goals A Shots H Shots A Market Odds Result
Later you add:
Corners, cards, possession, tempo metrics.
Closing odds, opening odds, and movement.
Your own derived stats (xG Diff, tempo index, rest days).
Simplicity ensures scalability.
3. Data Sources
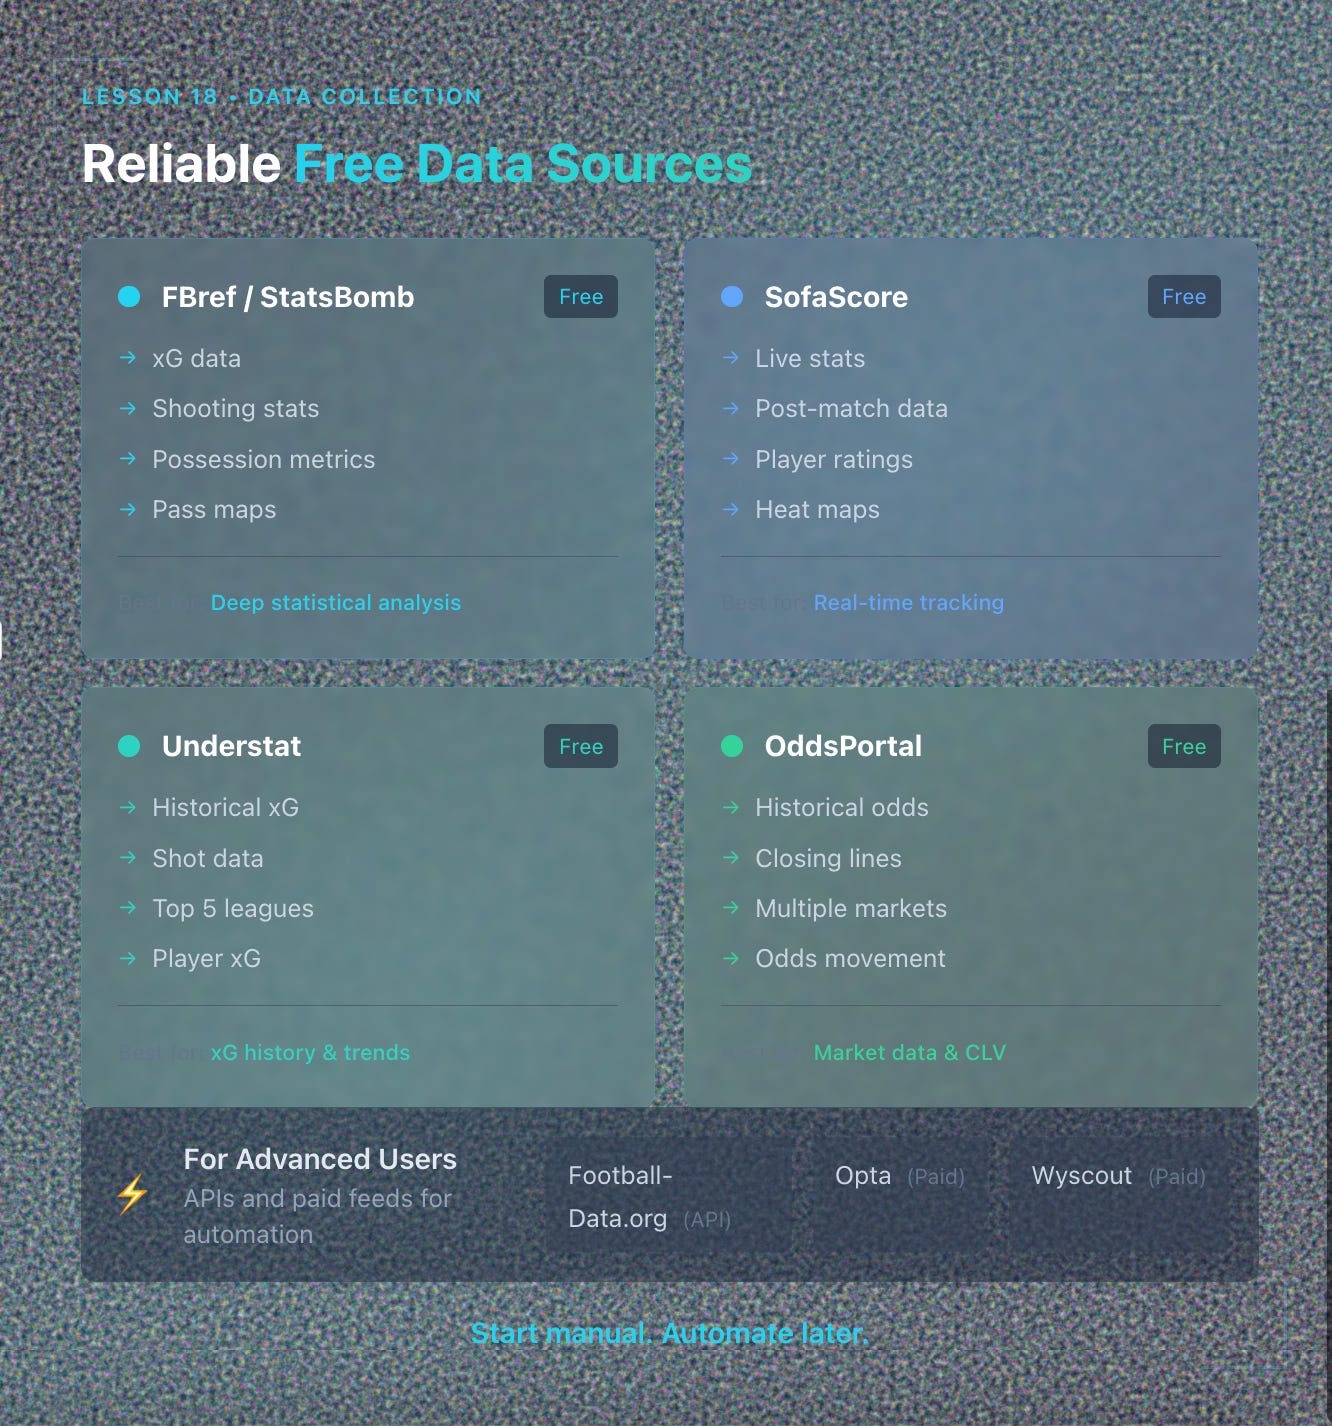
Reliable, free sources to begin with:
FBref / StatsBomb: xG, shooting, possession metrics.
SofaScore: Live & post-match stats.
Understat: Historical xG for top leagues.
OddsPortal / BetExplorer: Historical odds and closing lines.
For advanced users, APIs such as Football-Data.org or paid feeds (Opta, Wyscout) provide automation.
Start manual. Automate later.
4. Cleaning the Data
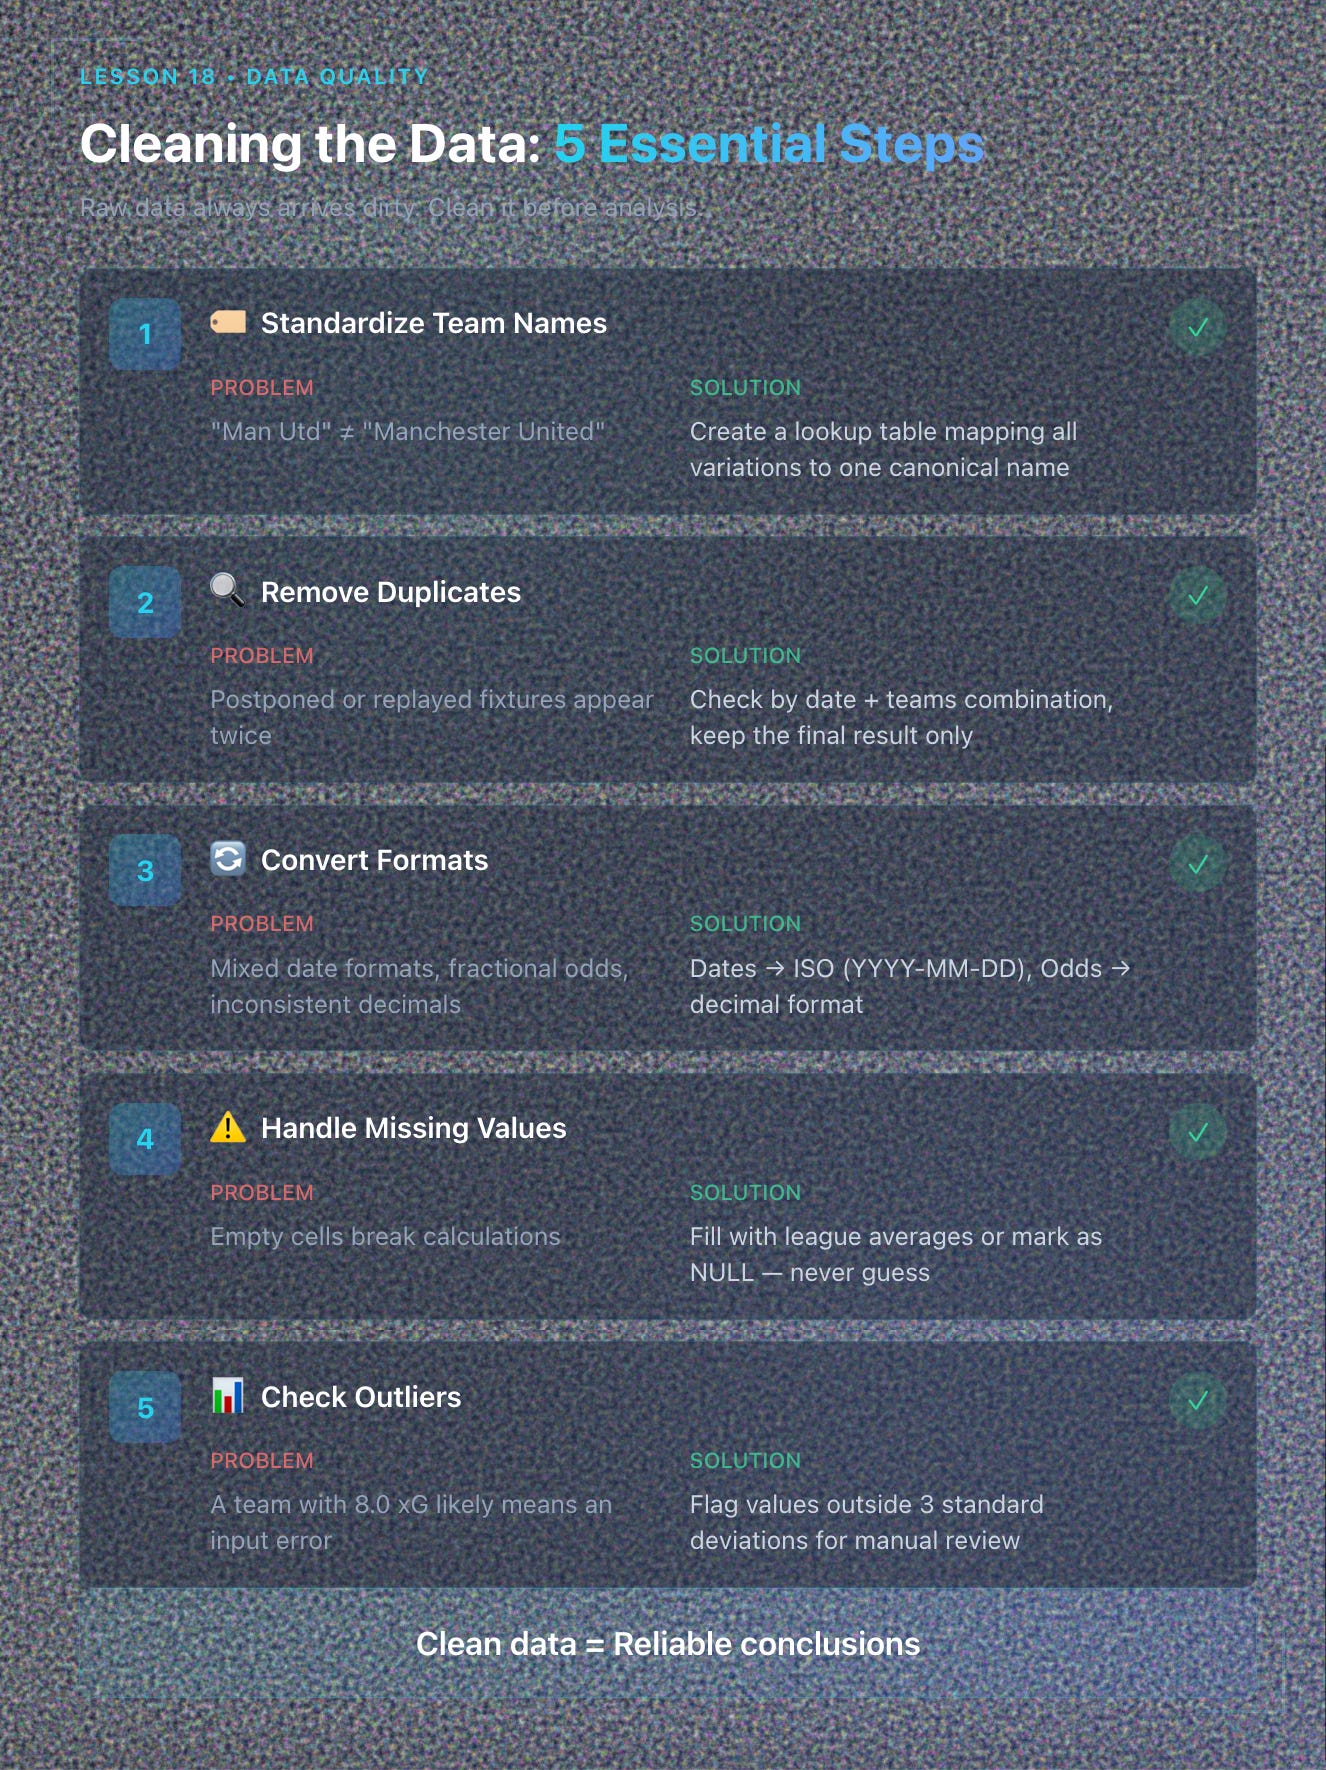
Raw data always arrives dirty.
Before analysis:
Standardize team names. (”Man Utd” ≠ “Manchester United”).
Remove duplicates. Check for postponed or replayed fixtures.
Convert formats. Dates to ISO (YYYY-MM-DD), decimals for odds.
Handle missing values. Fill with averages or mark as null.
Check outliers. A team with 8.0 xG likely means an input error.
Clean data = reliable conclusions.
5. Deriving Custom Metrics
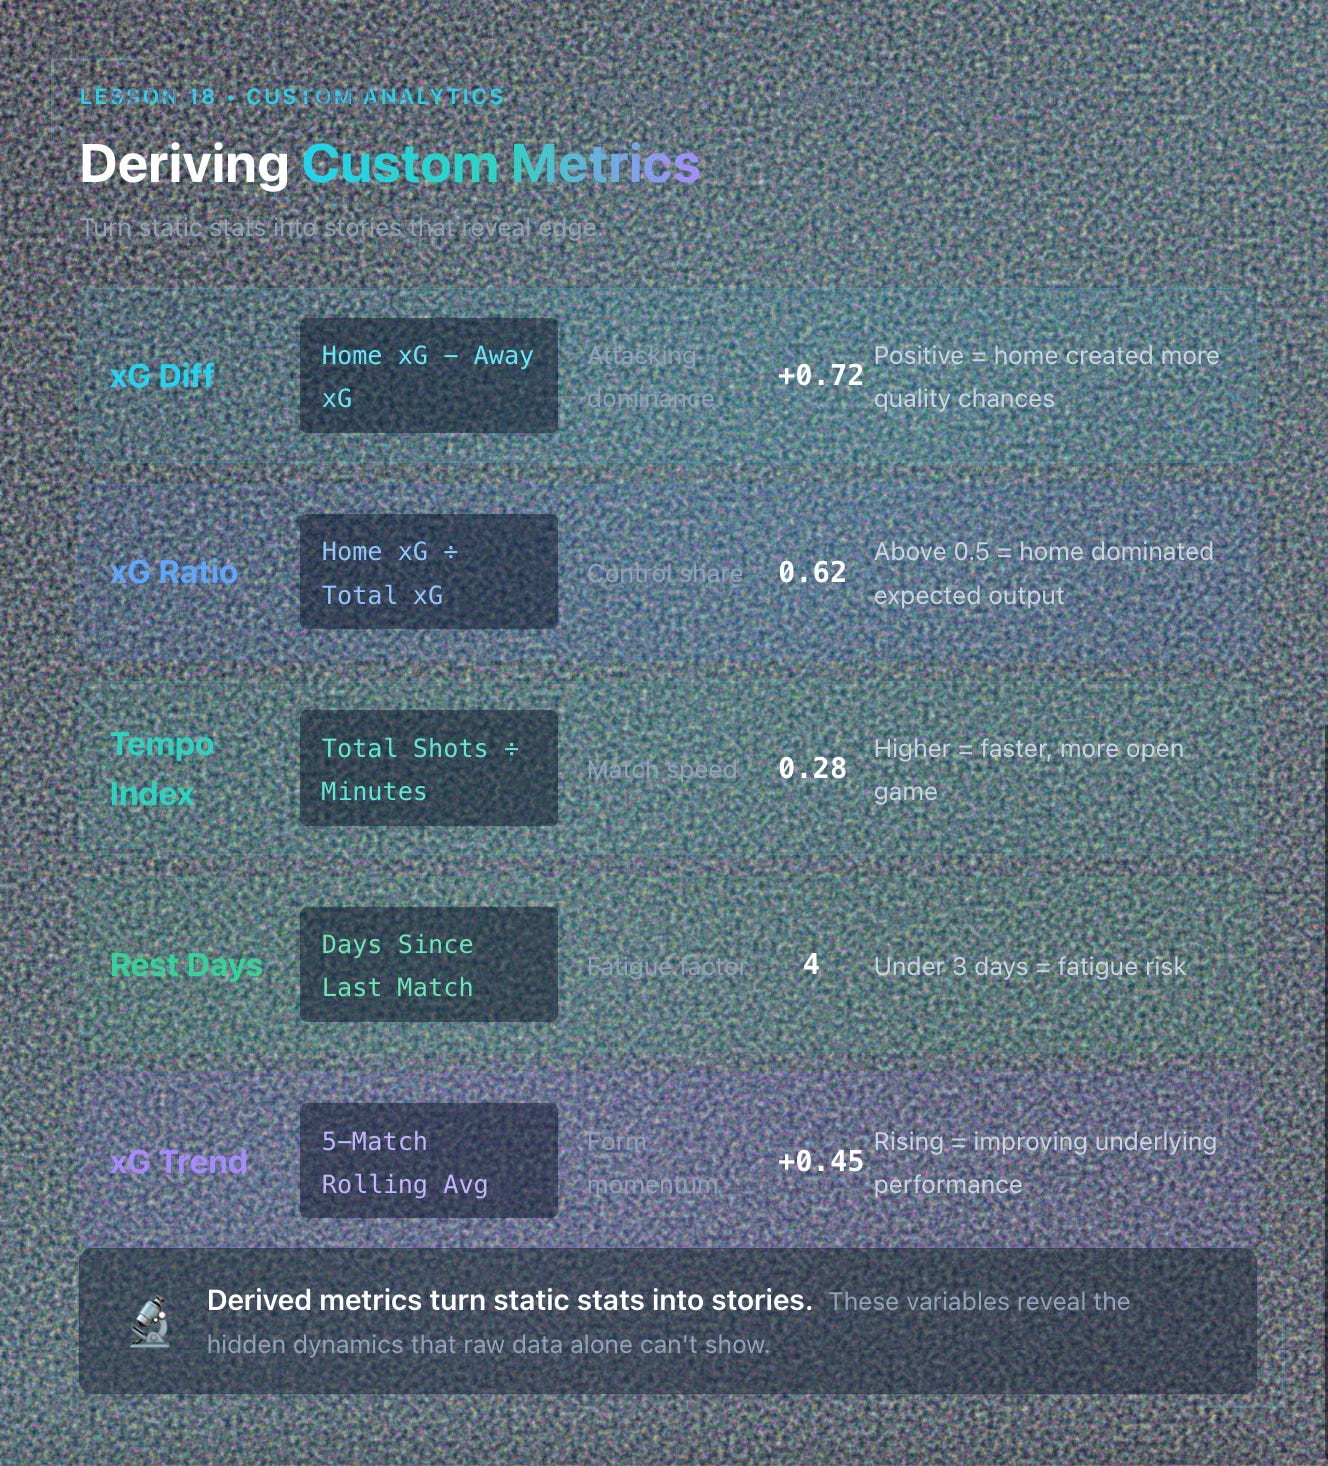
Once data is tidy, create variables that reveal edge:
Metric Formula Meaning xG Diff Home xG - Away xG Attacking dominance xG Ratio Home xG / Total xG Control share Tempo Index (Total Shots ÷ Minutes) Match speed Rest Days Days since last match Fatigue factor xG Trend (5-match avg) Rolling mean of xG Diff Form momentum
Derived metrics turn static stats into stories.
6. Building Infrastructure
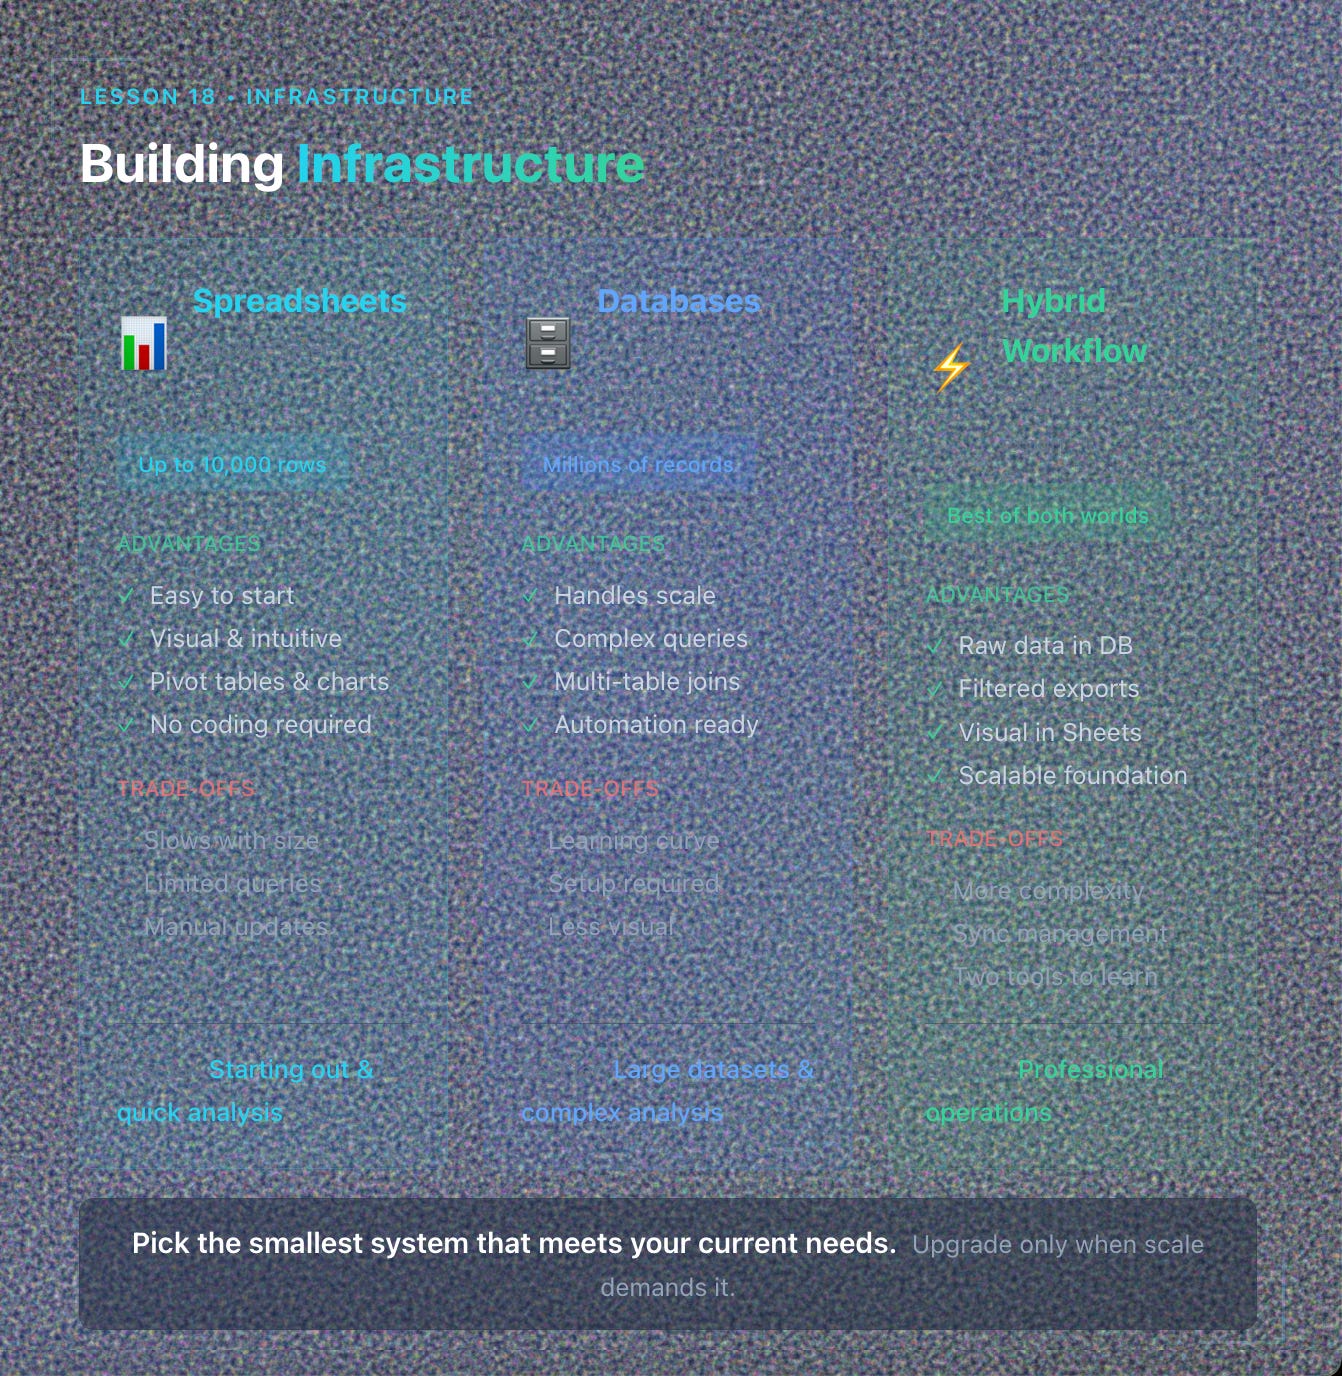
You have three main options:
Spreadsheets (Google Sheets / Excel)
Easy to start, visual.
Ideal up to 10,000 rows.
Integrate with pivot tables and charts.
Databases (SQLite / MySQL / PostgreSQL)
Handles millions of records.
Enables complex queries and joins.
Hybrid Workflow
Store raw data in a database.
Export filtered sets to Sheets for visual analysis.
Pick the smallest system that meets your current needs. Upgrade only when scale demands it.
7. Automating Updates
Manual entry works at first but drains time.
When you’re ready:
Use scripts (Python, R, or Google Apps Script) to pull API data daily.
Schedule updates with Cron or Task Scheduler.
Validate each import automatically (row count, date match).
Even semi-automation saves hours weekly and eliminates transcription errors.
8. Version Control and Backups
Your data is intellectual property. Protect it.
Keep two backups: one local, one cloud (Drive, Dropbox).
Timestamp every major update (like 2025-11-10-Master.csv).
Maintain a “data-dictionary” document describing column definitions.
If you change definitions (like xG source), log it.
Consistency beats quantity.
9. Using Your Database to Build Insight
Once you own clean, historical data, you can:
Back-test new systems instantly.
Correlate stats (like xG Diff vs odds movement).
Track trends across seasons.
Visualize value zones (heat maps of odds vs ROI).
Your database becomes a living laboratory. Every query teaches you something.
10. The Data Growth Mindset
Building a personal database isn’t a weekend project. It’s an ongoing habit.
Each week’s matches feed next month’s analysis.
Each new season deepens your sample size and accuracy.
Over time, your dataset becomes unique. Tailored to your logic, cleaned by your standards, and trusted by your intuition.
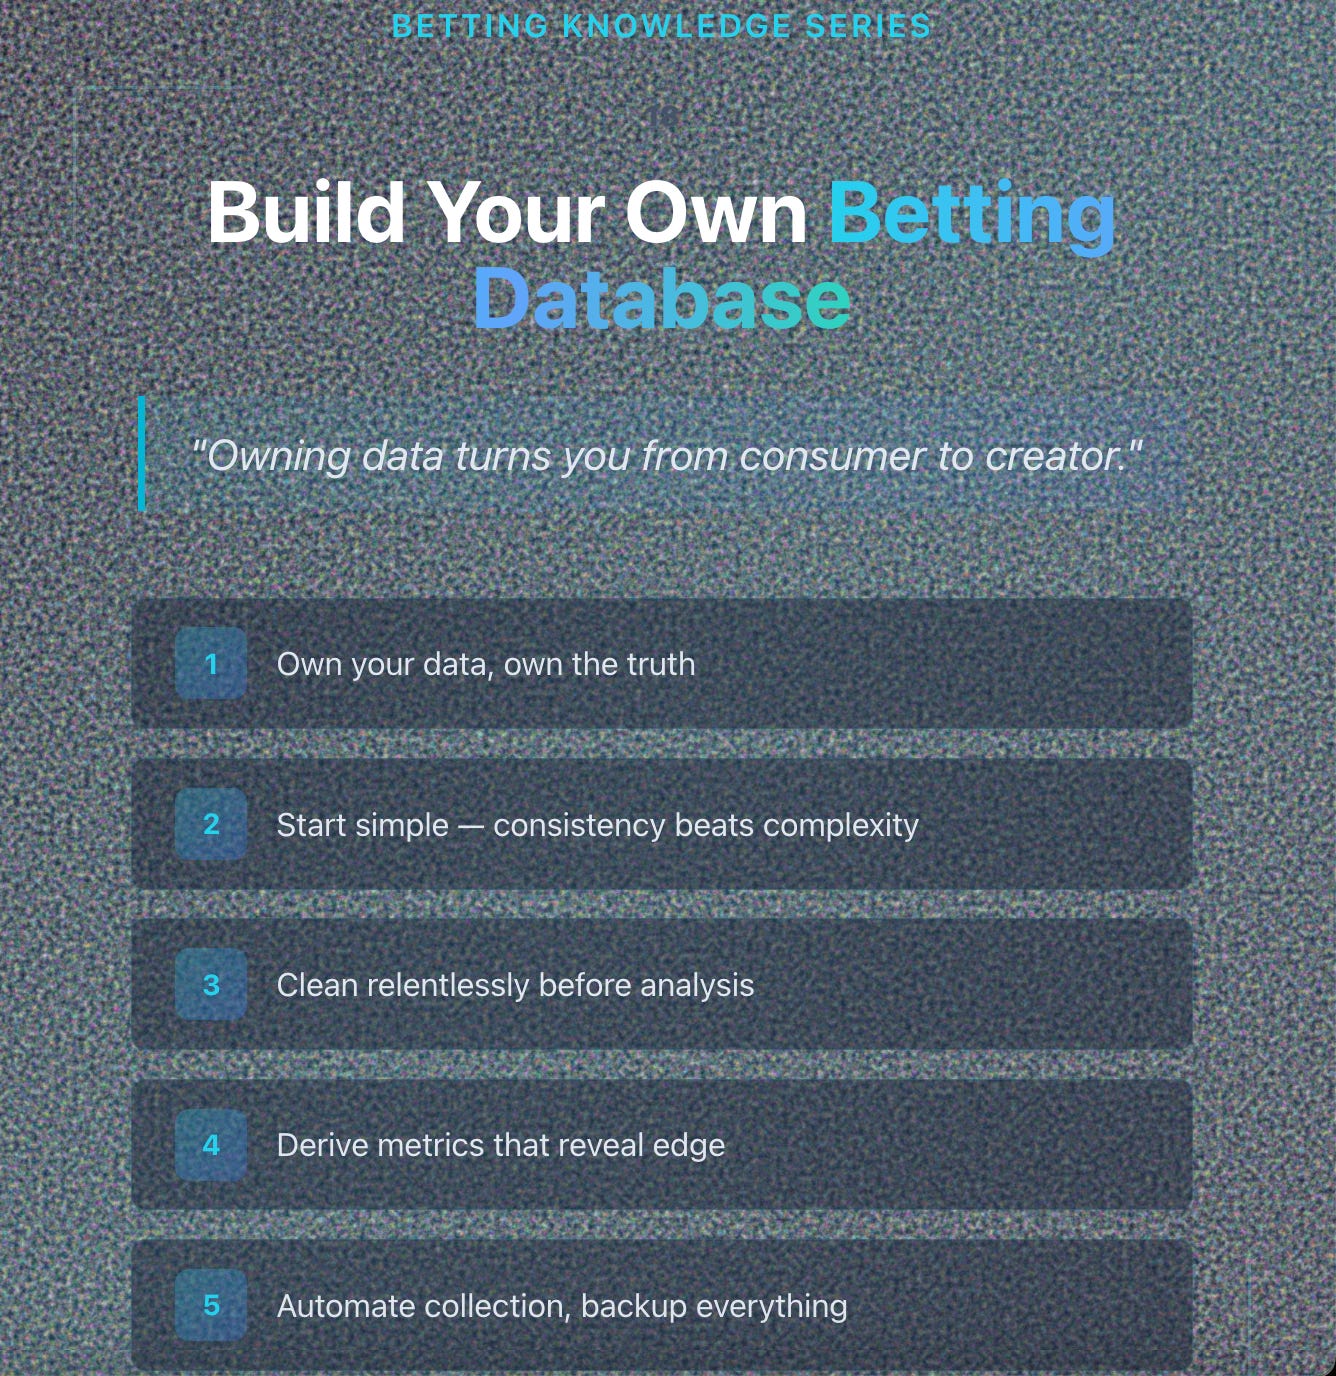
Owning data turns you from consumer to creator.
Key Takeaways
✅ Public data is inconsistent; owning clean data gives you control.
✅ Start simple. Consistent columns beat complex chaos.
✅ Clean and standardize relentlessly.
✅ Create derived metrics to reveal performance drivers.
✅ Automate collection and back up everything.
✅ Your database is a long-term asset. Maintain it like capital.
Next Lesson
📘 Lesson 19: Building a Predictive Model — Turning Data Into Probabilities
We’ll take your personal dataset and show how to use it to estimate true probabilities, calculate expected value automatically, and start modeling the market like a professional oddsmaker.