

Liquidity, Execution & Slippage: How Market Mechanics Shape Real ROI
Betting Knowledge — Lesson 23

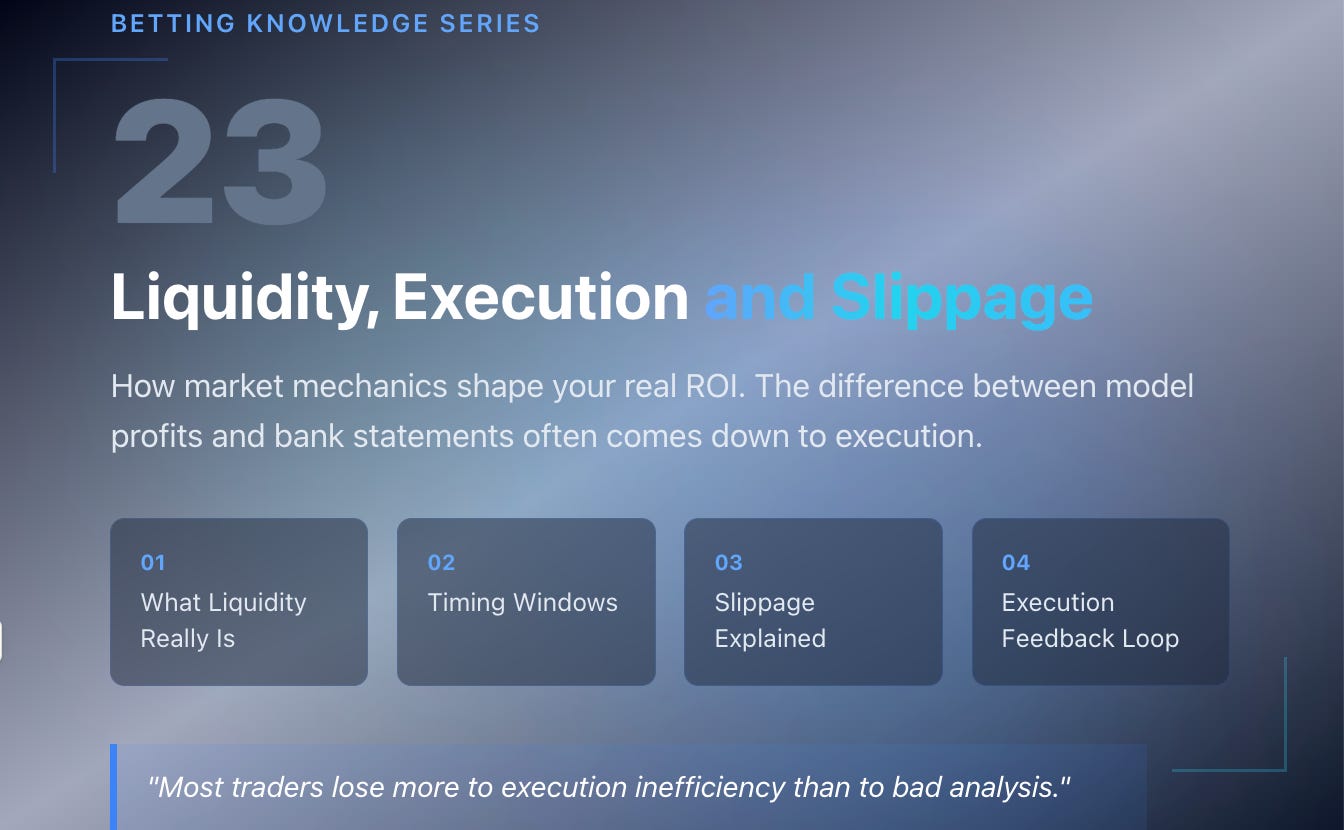
Betting Knowledge Series — Lesson 23
Liquidity, Execution & Slippage: How Market Mechanics Shape Real ROI.
Introduction
Most traders lose more to execution inefficiency than to bad analysis.
The difference between a model that predicts 6% ROI and the bank statement that shows 3% often comes down to how and when your money hits the market.
This lesson explains the mechanics of liquidity, order depth, and slippage. And how to master them so your realized returns match your theoretical edge.
1. What Liquidity Really Is
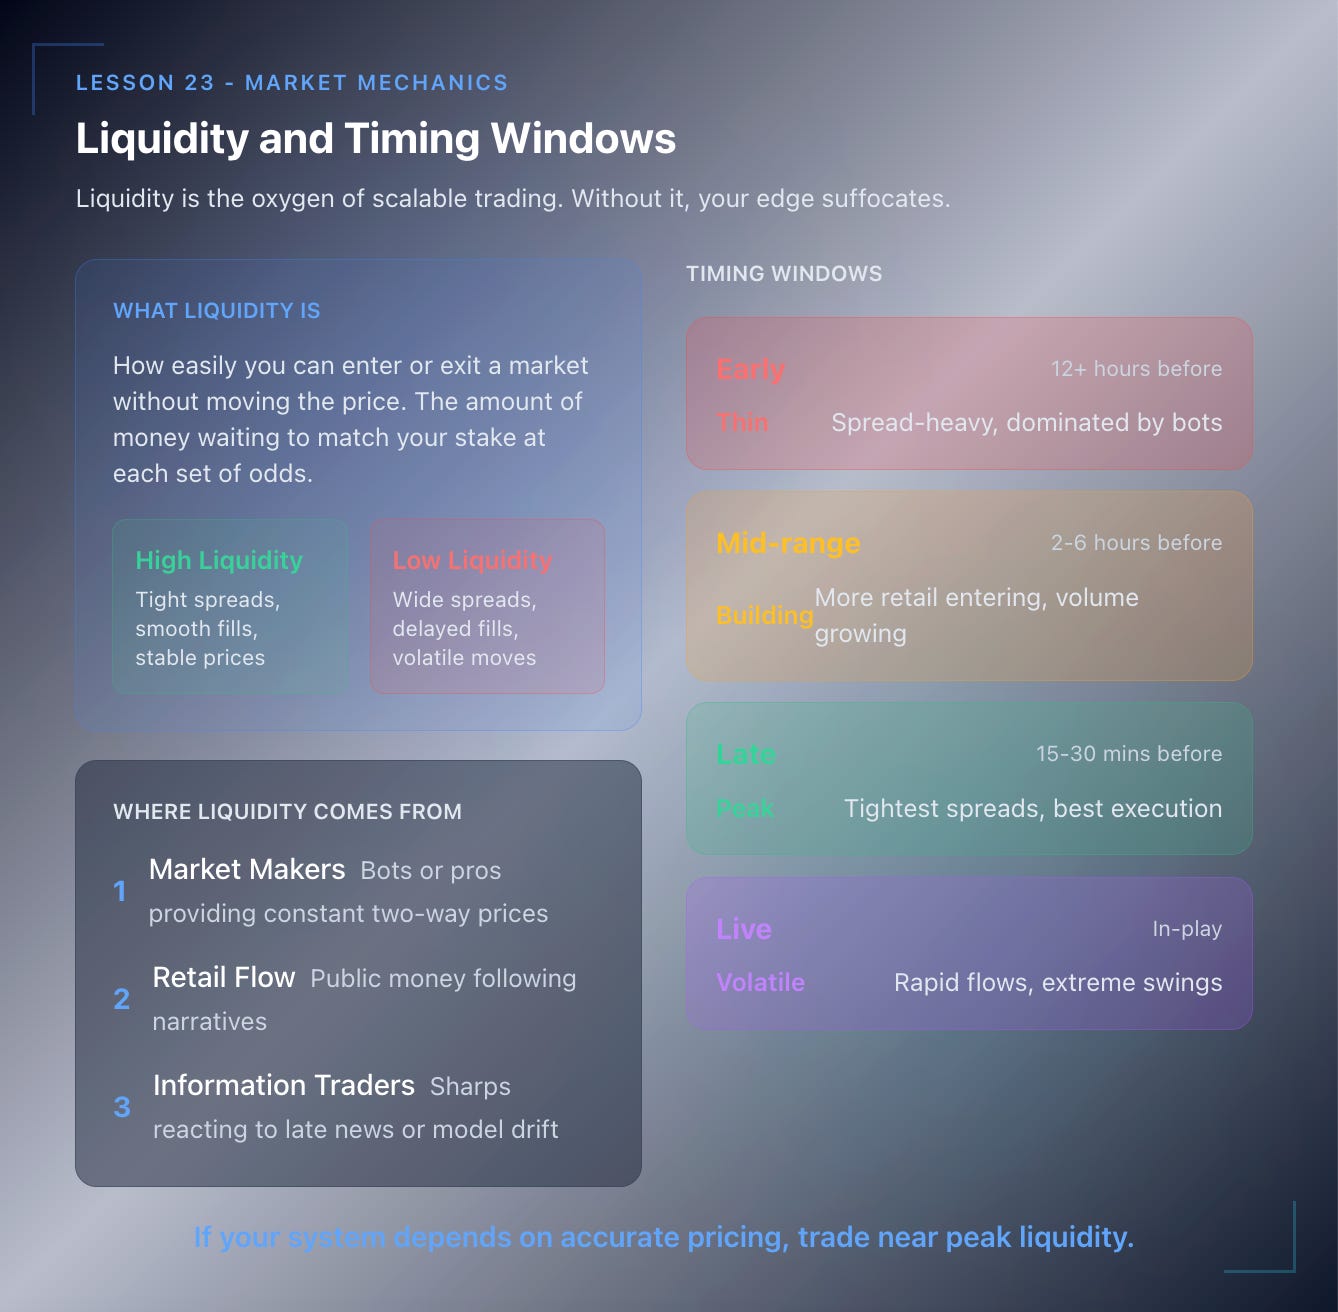
Liquidity measures how easily you can enter or exit a market without moving the price.
In betting terms, it’s the amount of money waiting to match your stake at each set of odds.
High liquidity = tight spreads, smooth fills, stable prices.
Low liquidity = wide spreads, delayed fills, volatile moves.
Liquidity is the oxygen of scalable trading. Without it, your edge suffocates.
2. Where Liquidity Comes From
1️⃣ Market Makers – bots or pros providing constant two-way prices.
2️⃣ Retail Flow – public money following narratives, especially before kick-off.
3️⃣ Information Traders – sharps reacting to late news or model drift.
Each group moves odds differently.
Understanding who’s active at what time helps you plan your entries. I’ve watched people get crushed trying to force trades during dead zones when only the bots are active.
3. Timing Windows
Liquidity isn’t constant through the day:
Early (12+ hours before kick-off): Thin, spread-heavy, dominated by bots.
Mid-range (2–6 hours): Building volume, more retail entering.
Late (15–30 mins): Peak liquidity, tightest spreads.
Live (in-play): Extremely volatile, rapid flows.
If your system depends on accurate pricing, trade near peak liquidity.
If it depends on early mispricing, enter early but with smaller stakes.
4. Order Book Dynamics
Visualize a Betfair ladder: each rung is an offer at a price.
When you place a back or lay order:
If matched instantly → you hit existing liquidity (market order).
If waiting to be matched → you provide liquidity (limit order).
Hitting gets you execution but costs spread.
Providing saves spread but risks missing fills.
Sharps mix both: partial limit entries to get better price, market orders when time-sensitive.
5. Slippage Explained
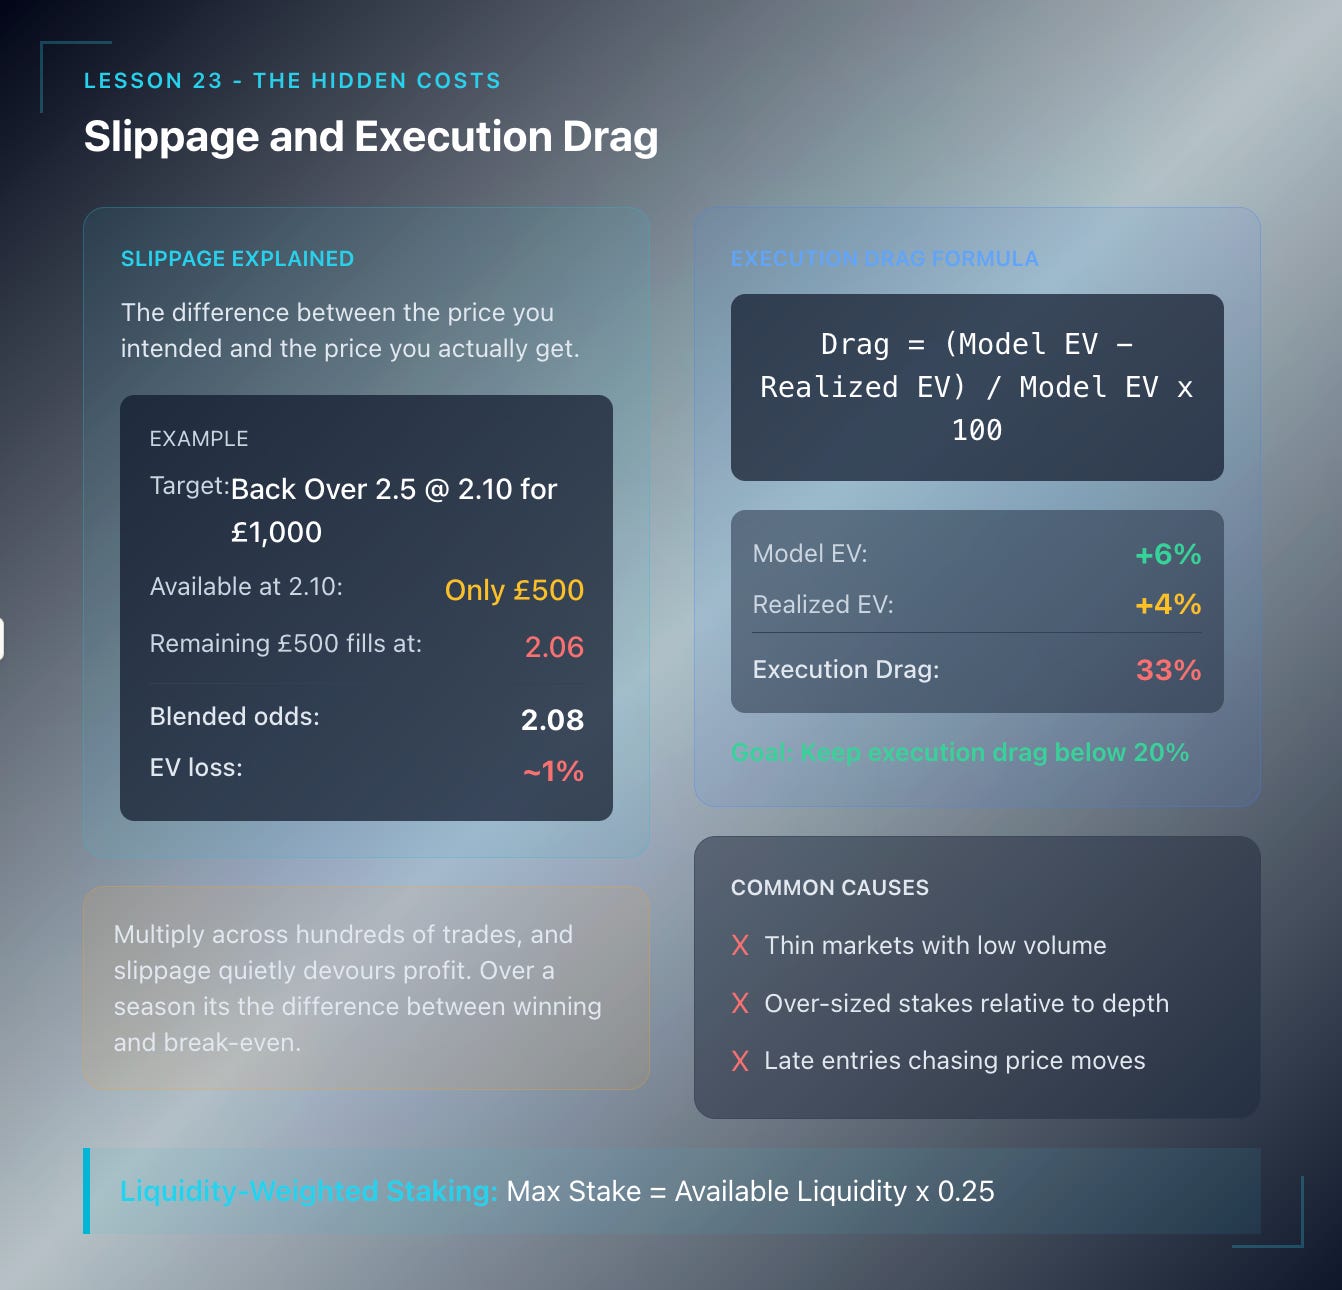
Slippage is the difference between the price you intended and the price you actually get.
Example:
You aim to back Over 2.5 @ 2.10 for £1,000, but only £500 available.
Remaining £500 fills at 2.06.
Your blended odds = 2.08.
That 0.02 gap cuts EV by roughly 1%.
Multiply across hundreds of trades, and slippage quietly devours profit. You might not notice it trade by trade, but over a season it’s the difference between a winning year and a break-even one.
6. Quantifying Execution Drag
Track it like any other metric:
\text{Execution Drag} = \frac{\text{Model EV} - \text{Realized EV}}{\text{Model EV}} \times 100
If model EV = +6% but realized EV = +4%, drag = 33%.
Common causes:
Thin markets.
Over-sized stakes.
Late entries chasing price moves.
Goal: keep execution drag < 20%.
7. Liquidity-Weighted Staking
Adapt stake size to liquidity, not ego.
Simple formula:
\text{Max Stake} = \text{Available Liquidity} \times 0.25
If £2,000 sits at your target price, cap your order at £500.
This prevents self-inflicted slippage and preserves anonymity in smaller pools. Nobody needs to know you’re there.
8. Improving Execution Quality

✅ Pre-Place Orders – queue early at preferred prices.
✅ Use Partial Fills – let half match early, half later at better odds.
✅ Automate Alerts – trigger entries when liquidity threshold hit.
✅ Benchmark CLV vs Entry Time – find your optimal window.
✅ Avoid Chasing Moves – when odds collapse, wait for re-balancing instead of forcing entry.
Execution is a craft. Small upgrades compound massively.
9. When to Accept Slippage
Occasionally, the information edge outweighs price friction.
Like, live-xG signals show pressure building and Over odds are drifting from 2.10 → 2.06.
Missing the goal opportunity costs more than a few ticks of price.
The rule:
Accept slippage only when timing is the edge itself.
Otherwise, patience pays better than speed. I know traders who’ve built entire strategies around just waiting for better fills.
10. Building an Execution Feedback Loop
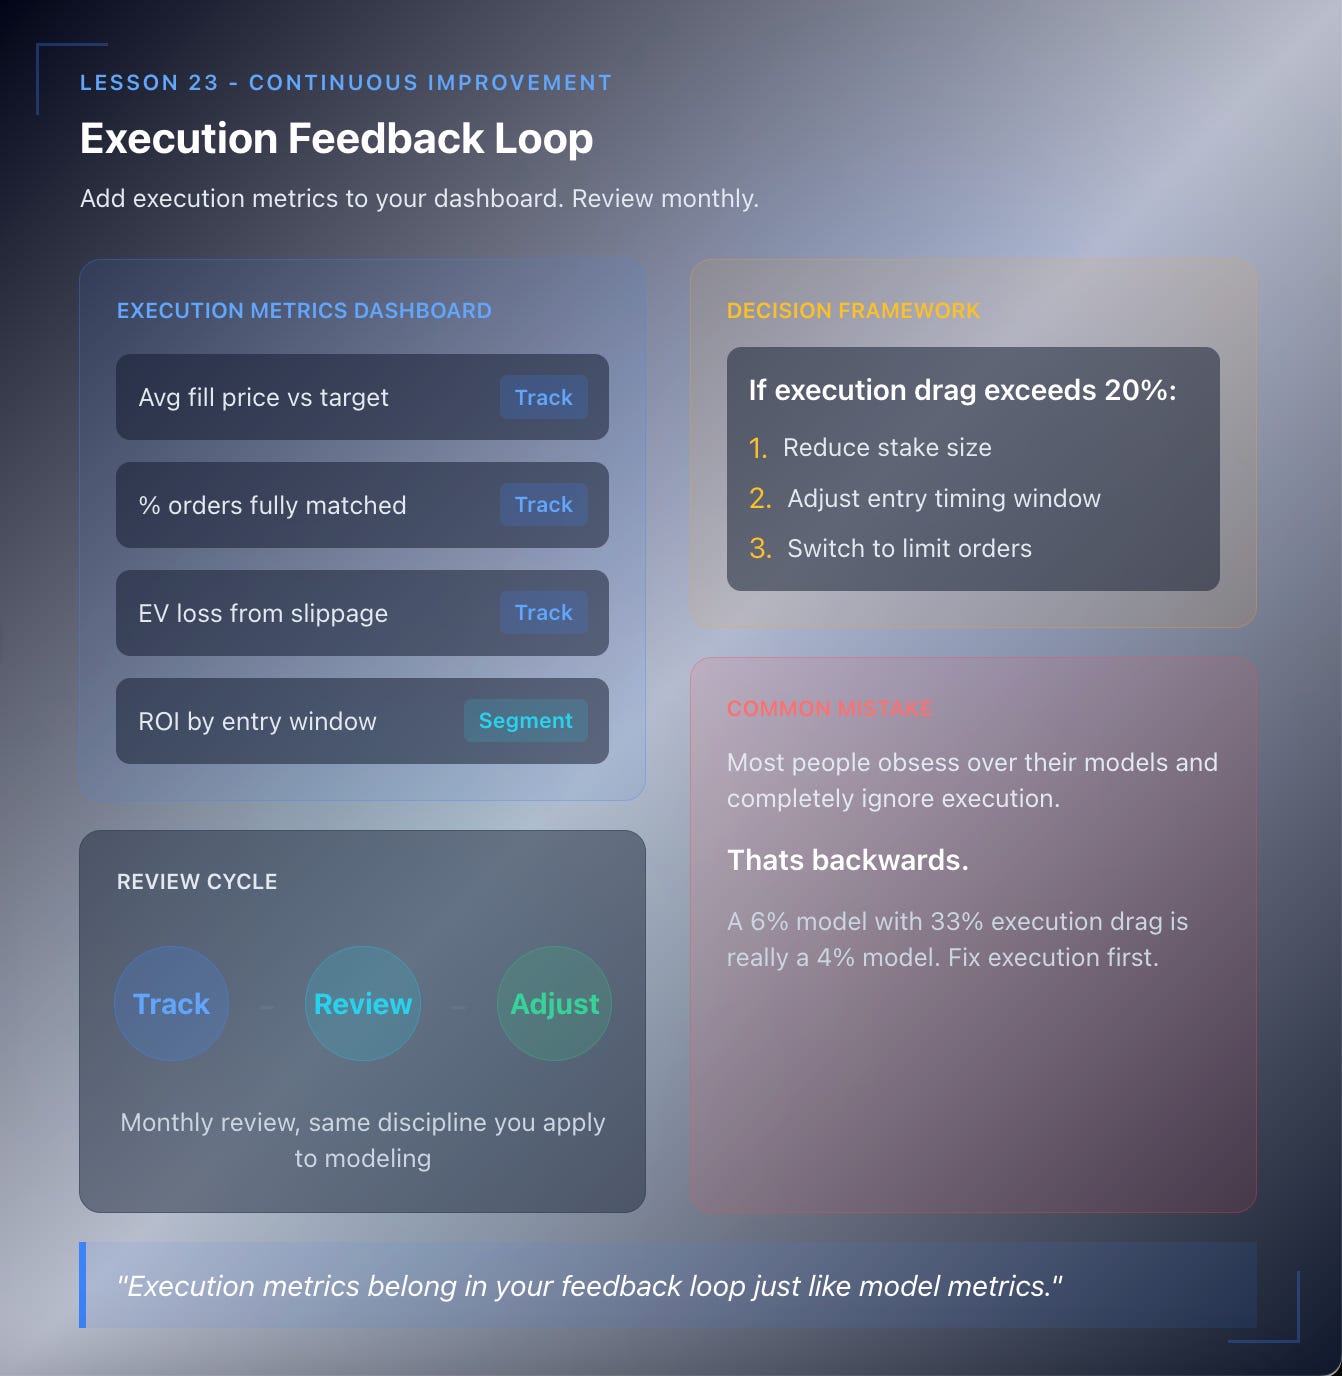
Add execution metrics to your dashboard:
Average fill price vs target.
% orders fully matched.
EV loss from slippage.
ROI segmented by entry window.
Review monthly.
If execution drag exceeds limits, adjust stake size or timing. Same feedback discipline you apply to modeling. Most people obsess over their models and completely ignore execution. That’s backwards.
Key Takeaways
✅ Liquidity = your ability to trade size without moving price.
✅ Slippage silently erodes EV. Measure it.
✅ Adapt stake size to market depth.
✅ Peak liquidity = late markets; early entries need restraint.
✅ Providing liquidity gets better price but may miss fills.
✅ Execution metrics belong in your feedback loop.
Next Lesson
📘 Lesson 24 – Scaling Beyond Bookmakers: Exchanges, Brokers & Professional Infrastructure
We’ll look at how professionals expand beyond standard bookmaker accounts. Using exchanges, brokers, and API tools to trade at scale while managing limits and access like a small trading desk.