


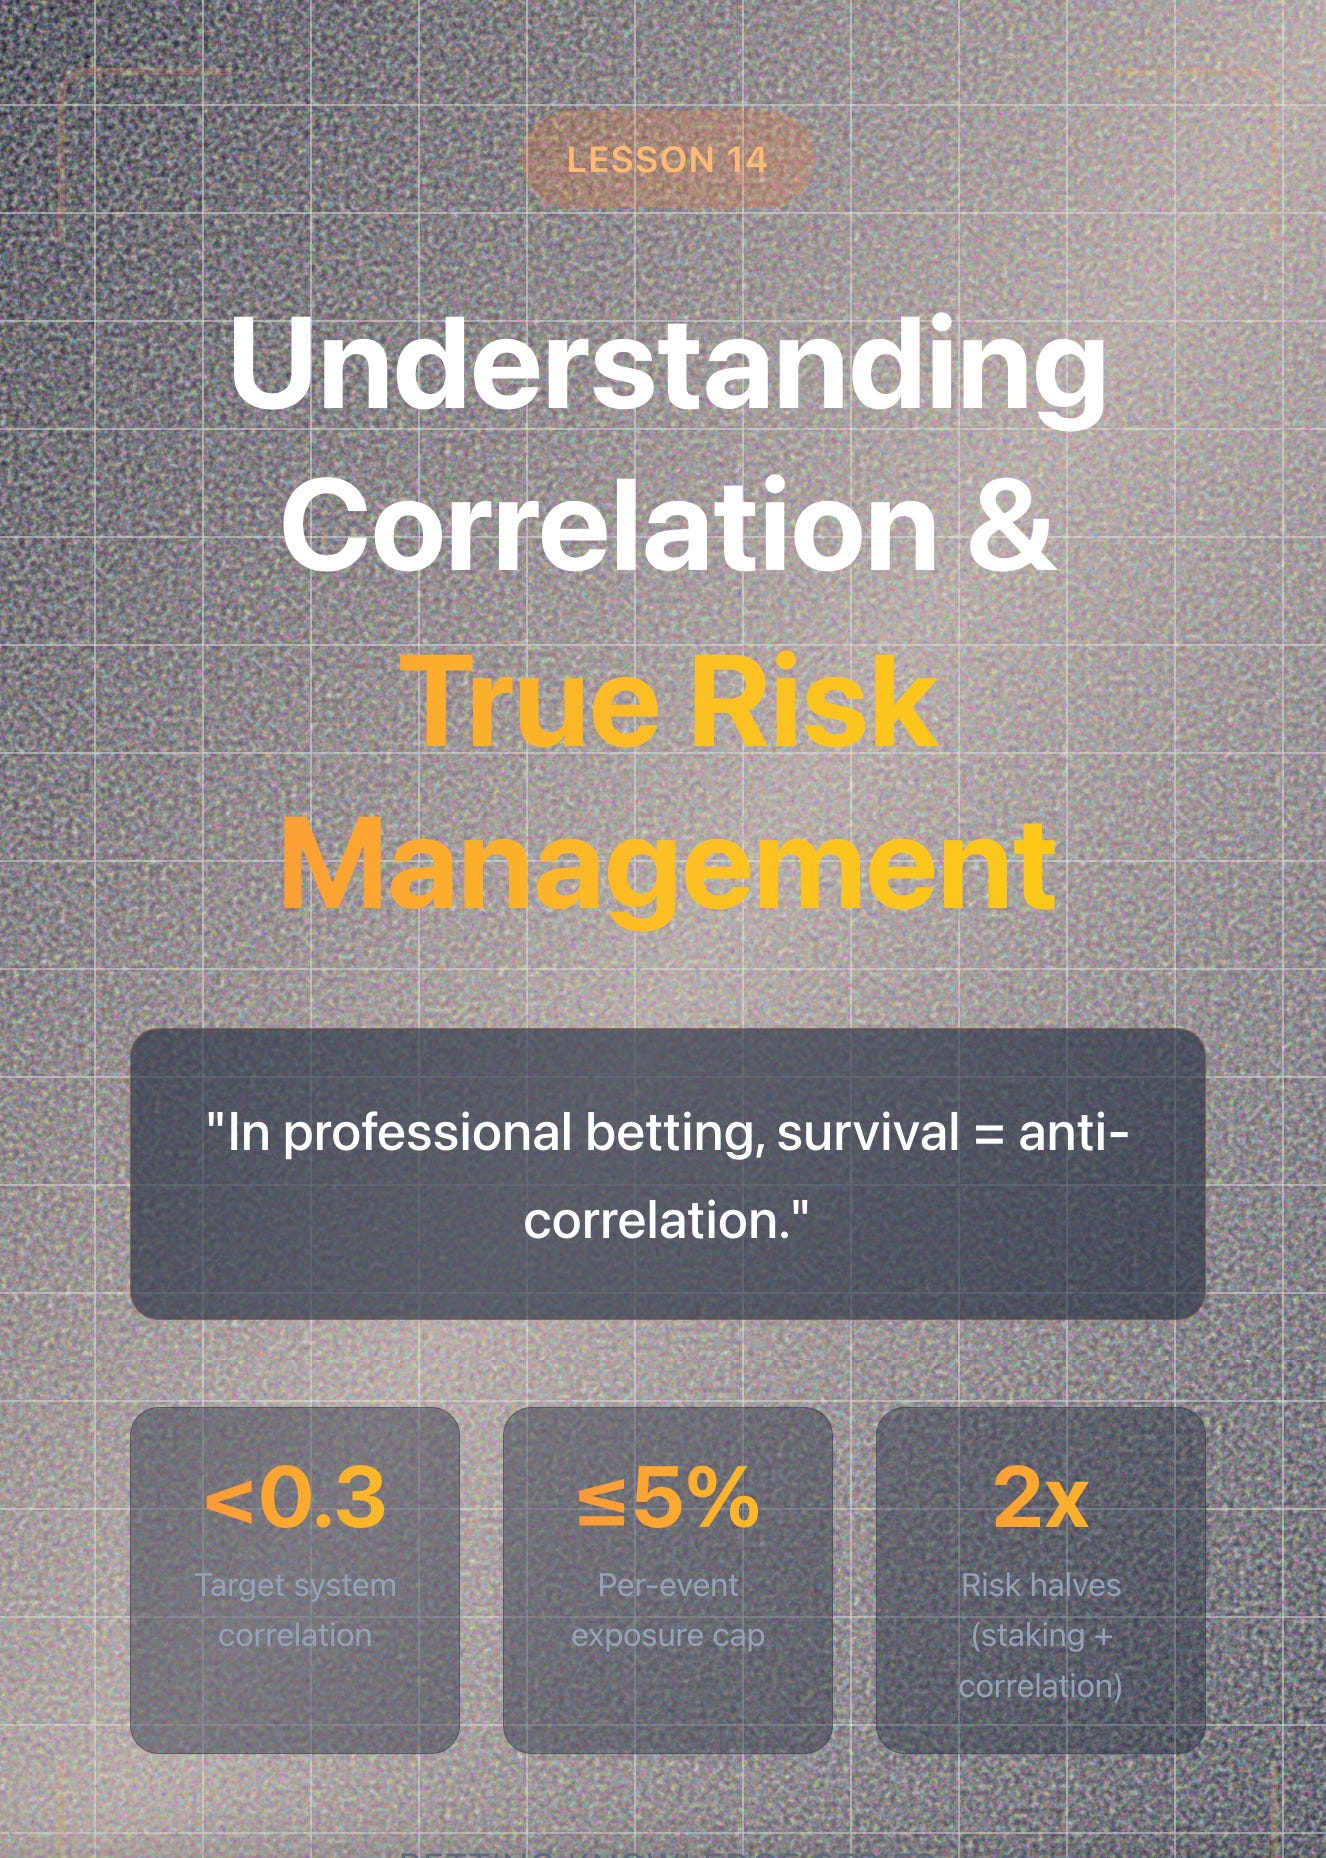
Betting Knowledge Series — Lesson 14
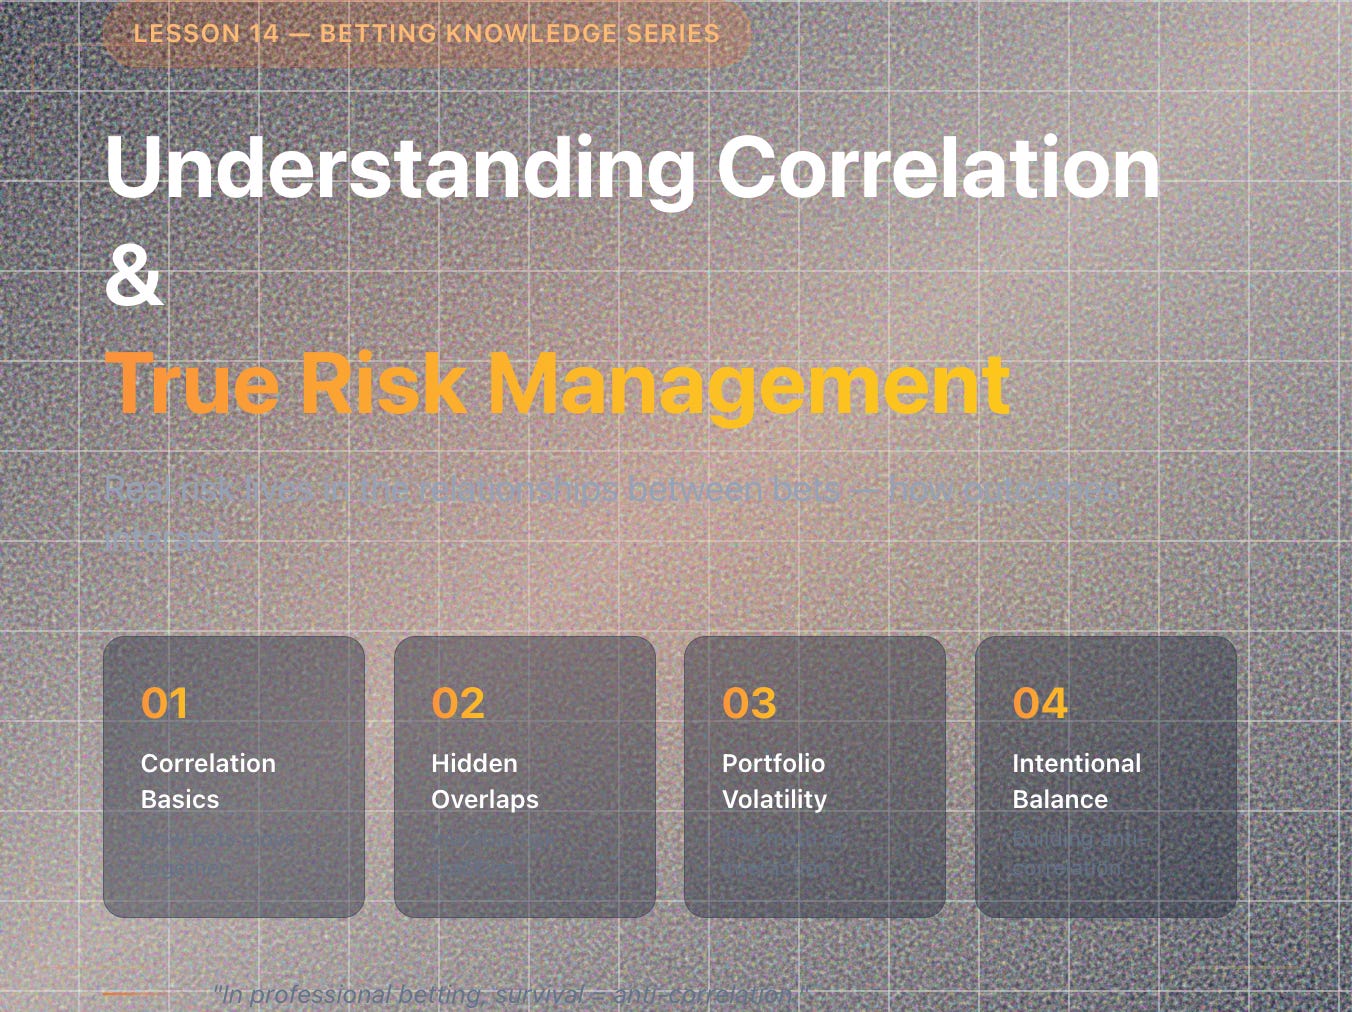
Understanding Correlation and True Risk Management
Introduction
Most bettors think of risk as stake size.
Professionals know that’s only half the story.
Real risk lives in the relationships between bets. How outcomes interact.
Professionals know that’s only half the story.
Real risk lives in the relationships between bets. How outcomes interact.
Two bets look safe in isolation but still double your danger if they move in the same direction.
Understanding correlation is how you stop invisible overlap from wrecking your bankroll.
1. Correlation in Simple Terms
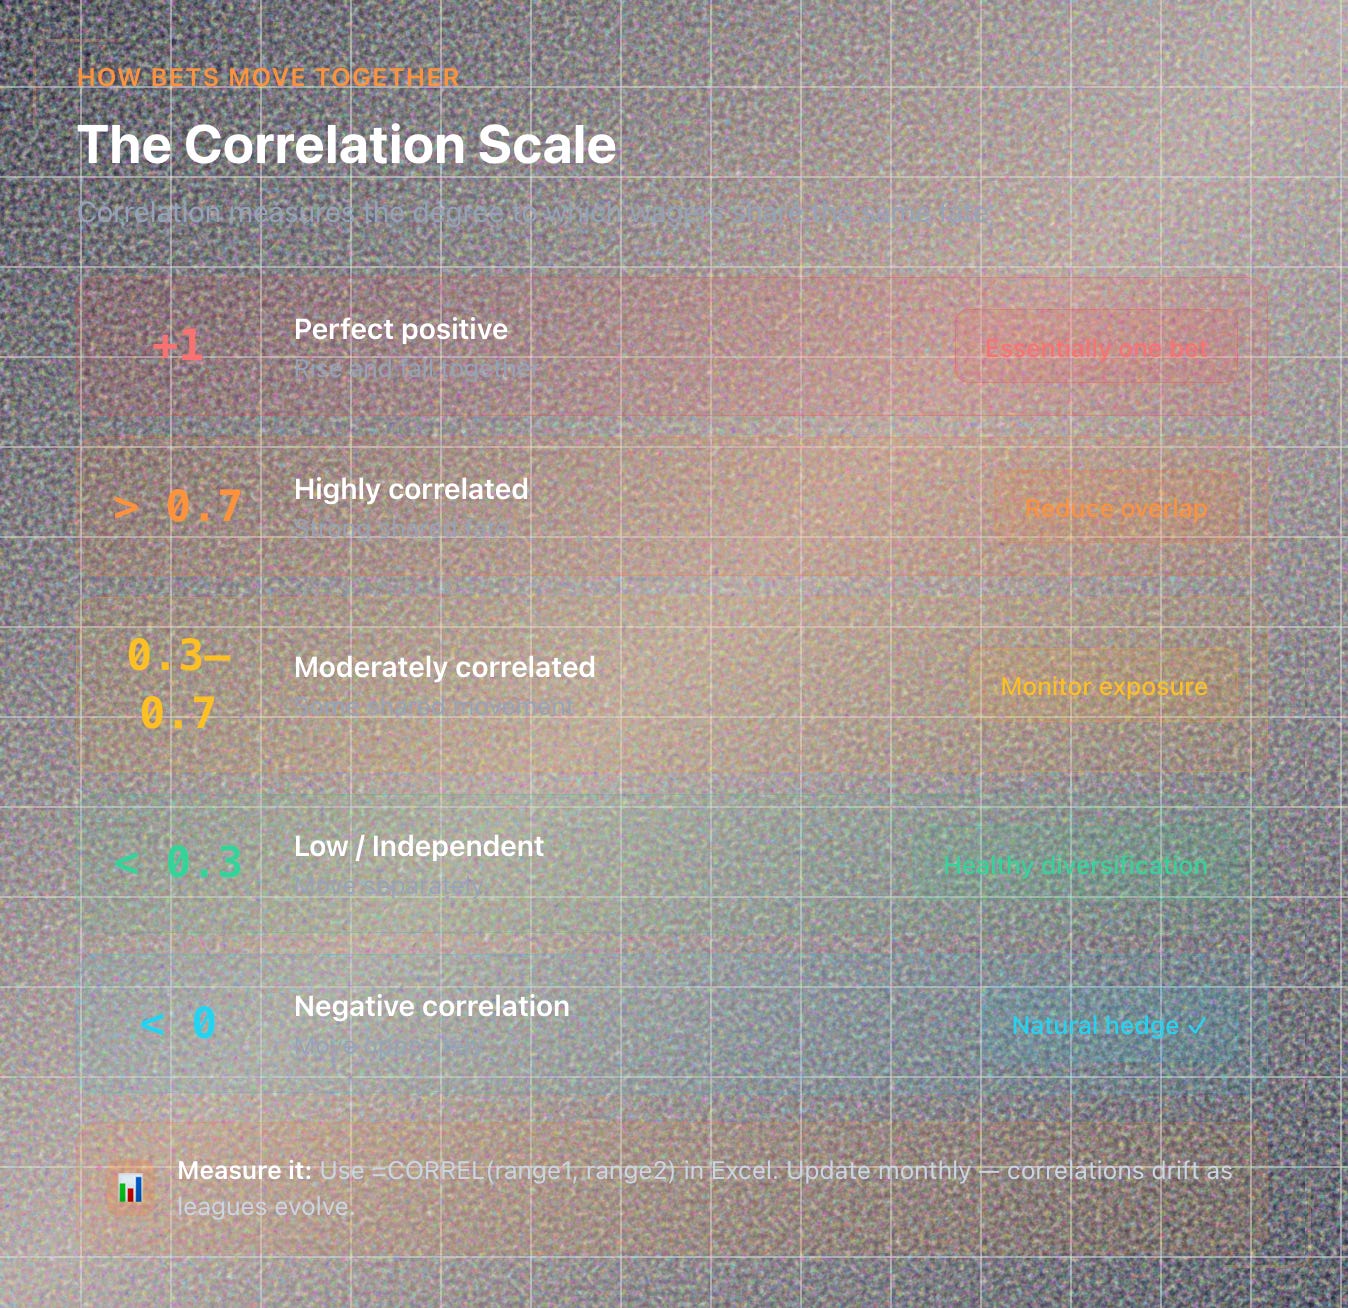
Correlation measures how two variables move relative to each other.
A correlation of +1 = they rise and fall together.
0 = they move independently.
-1 = they move oppositely.
In betting, correlation means the degree to which your wagers share the same fate.
If both depend on similar factors (like goals scored or a single team’s form), you’re effectively placing one larger bet, not two small ones.
2. Hidden Correlation Examples
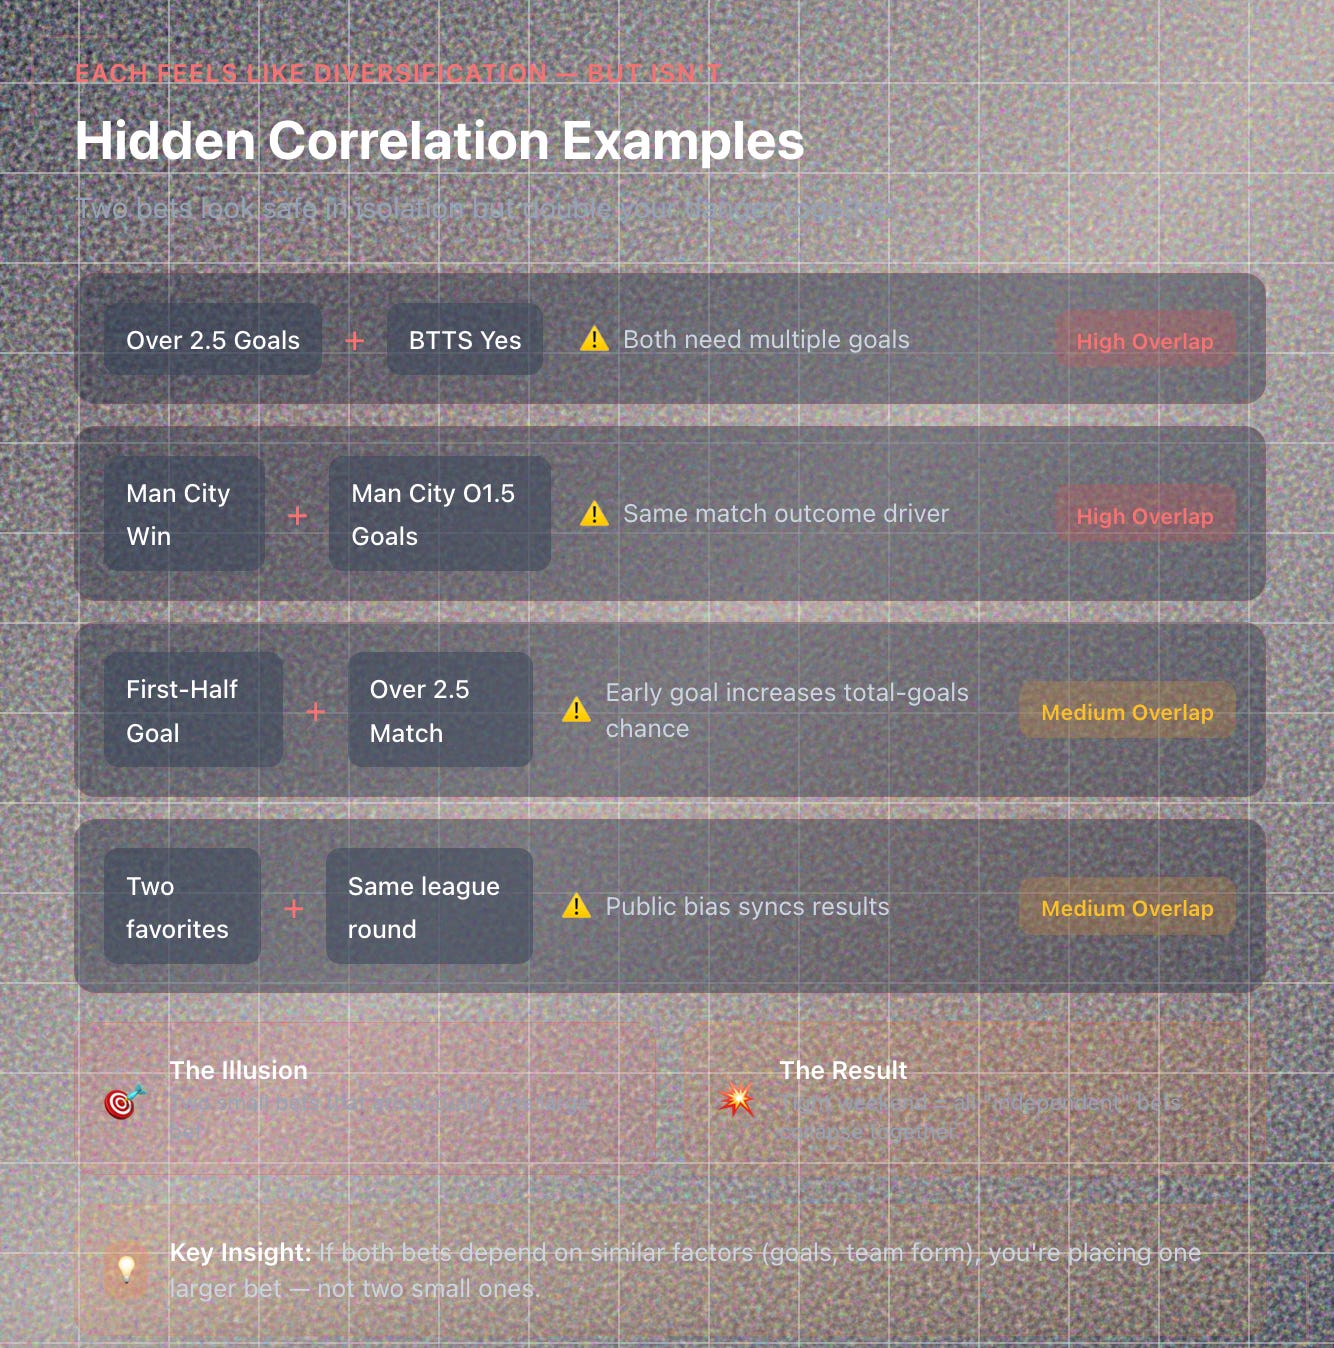
Situation Why It’s Correlated Over 2.5 Goals + BTTS Yes Both need multiple goals. Man City Win + Man City Over 1.5 Goals Same match outcome driver. First-Half Goal + Over 2.5 Full Match Early goal increases total-goals chance. Two favorites in same league round Public bias and momentum often sync results.
Each feels like diversification but isn’t.
If the league plays unusually tight that weekend, all your “independent” bets collapse together.
3. Covariance: The Math Behind the Movement
Covariance quantifies the direction of co-movement.
While correlation standardizes between -1 and +1, covariance keeps raw scale.
Cov(X,Y) = E[(X - E[X])(Y - E[Y])]
You don’t need to calculate it daily, but knowing that variance + covariance = portfolio volatility helps you respect aggregation.
In simple terms: Total risk = individual risk + interaction risk.
That interaction risk is what most punters ignore.
4. Portfolio Volatility Formula (Simplified)
If you run two systems A and B:
σ_P = √[ w_A²σ_A² + w_B²σ_B² + 2w_Aw_Bρ_ABσ_Aσ_B ]
Where:
w = capital weight
σ = standard deviation (volatility)
ρ = correlation
Key insight: even if each system’s volatility is small, a high ρ makes total volatility large.
Low or negative ρ shrinks it dramatically.
5. How to Measure Correlation in Practice
Record sequential profits per system or market.
Use a spreadsheet: =CORREL(range1, range2)
Interpret results:
ρ Meaning Action > 0.7 Highly correlated Reduce overlap 0.3–0.7 Moderately correlated Monitor exposure < 0.3 Low / independent Healthy diversification < 0 Negative Natural hedge
Update monthly. Correlations drift as leagues and tactics evolve.
6. Building Intentional Balance
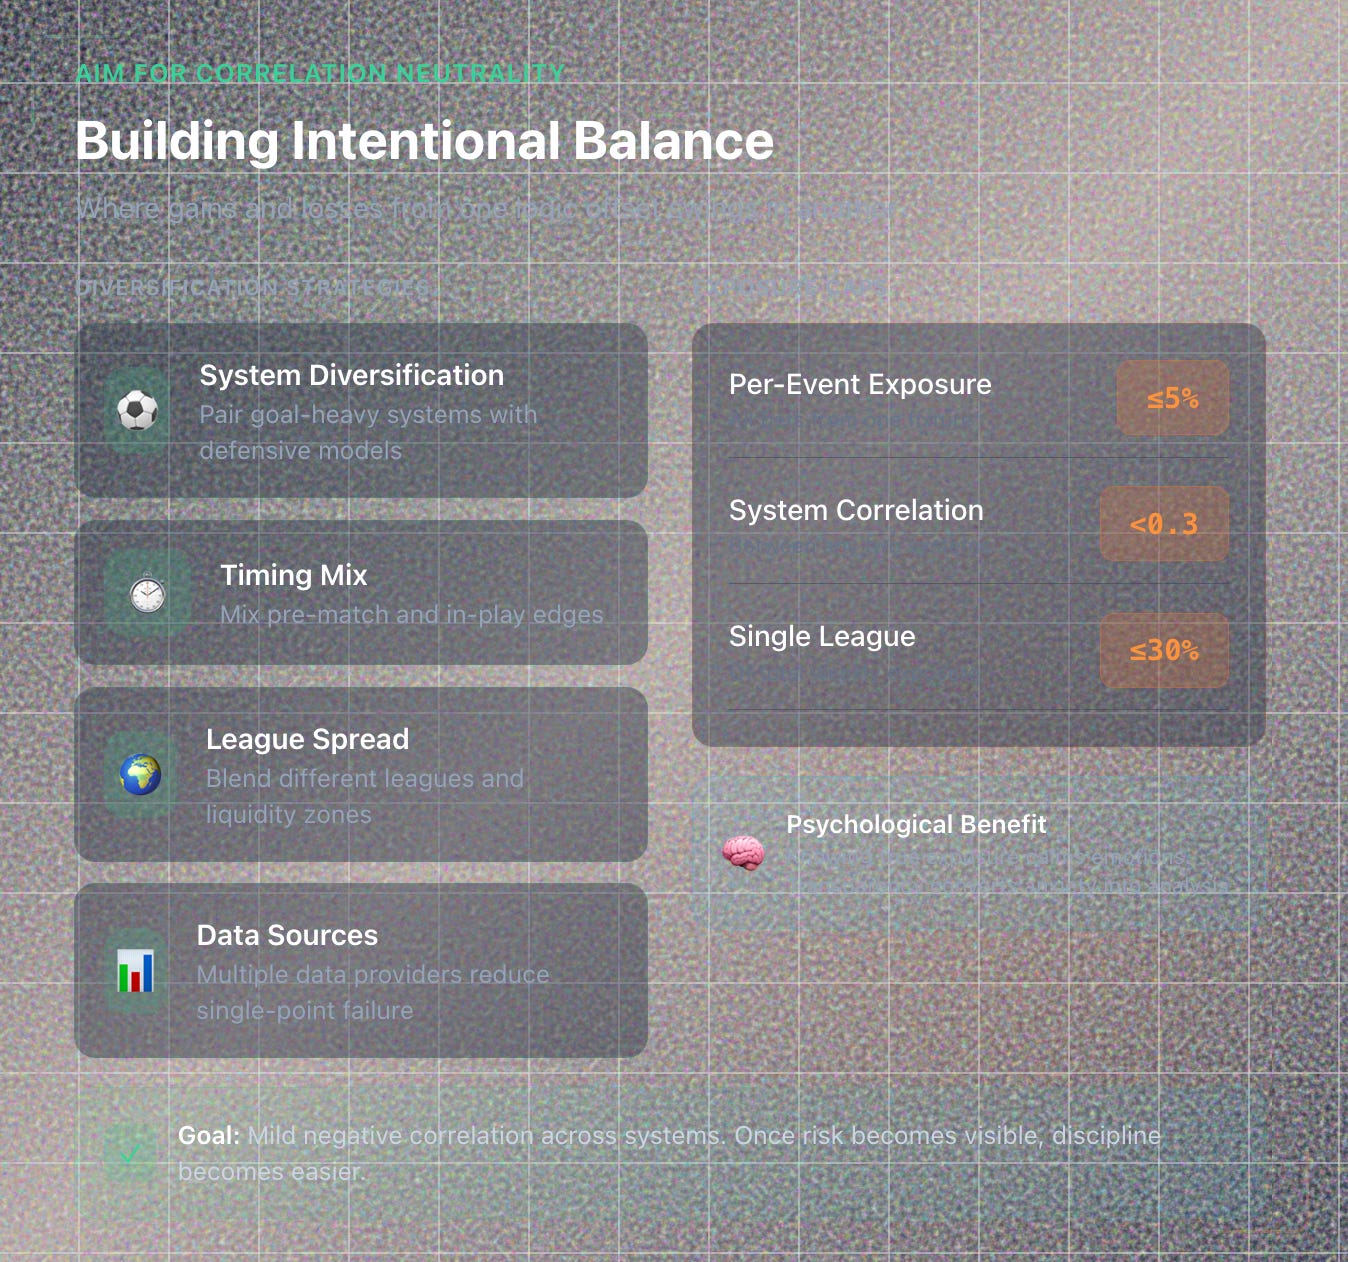
Once you know your overlaps, adjust exposure:
Pair goal-heavy systems with low-scoring or defensive models.
Mix pre-match and in-play edges.
Blend different leagues or data sources.
Aim for correlation neutrality. Where gains and losses from one logic offset swings in another.
7. Event-Level Risk Stacking
Correlation also exists within a single match.
If you have five props tied to the same game (shots, cards, goals, win), you’re overexposed to one event’s randomness.
Use a per-event exposure cap. For example, no more than 5% of bankroll on all bets from one fixture.
That protects you when a freak red card ruins the script.
8. Dynamic Exposure Tracking
Automation helps keep you honest.
Set up a dashboard showing:
Stake per system.
Stake per event.
Correlation heat map.
Expected volatility.
When exposure spikes above thresholds, scale down new positions automatically.
Treat risk as a measurable resource, not a feeling.
9. Psychological Benefits of Correlation Awareness
Knowing your true exposure calms emotions.
You stop overreacting to clusters of losses because you expect them when correlation is high.
Transparency converts anxiety into analysis. Once risk becomes visible, discipline becomes easier.
10. The Professional Risk Equation
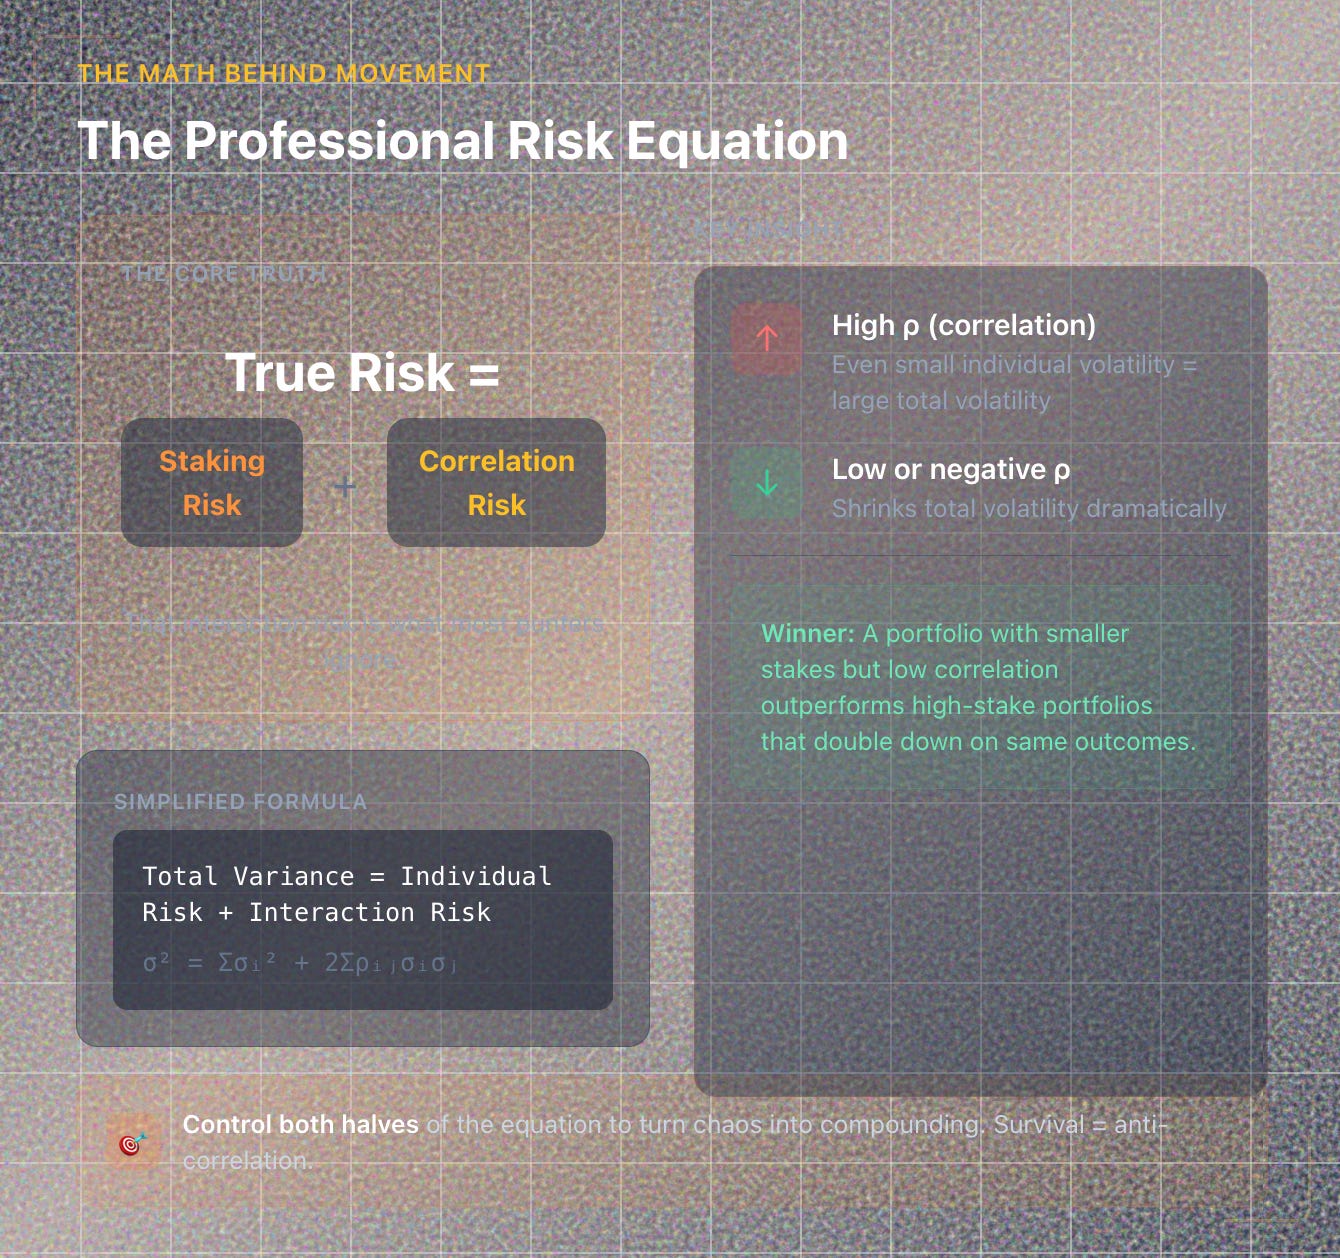
True Risk = Staking Risk + Correlation Risk
Controlling both halves turns chaos into compounding.
A portfolio with slightly smaller stakes but low correlation will outperform a high-stake portfolio that doubles down on the same outcomes.
In professional betting, survival = anti-correlation.
Key Takeaways
✅ Correlation measures how your bets move together. Hidden risk lives there.
✅ Independence between systems stabilizes bankroll growth.
✅ Covariance explains why portfolio volatility ≠ sum of individual risks.
✅ Track correlation monthly and limit per-event exposure.
✅ Aim for correlation neutrality or mild negative correlation across systems.
✅ True mastery = managing both mathematics and emotion of connected risk.
Next Lesson
📘 Lesson 15: How to Use Bankroll Segmentation to Protect Capital and Test New Ideas
We’ll look at how professionals divide their bank into “core capital” and “experimental capital,” allowing safe innovation without jeopardizing long-term growth.