

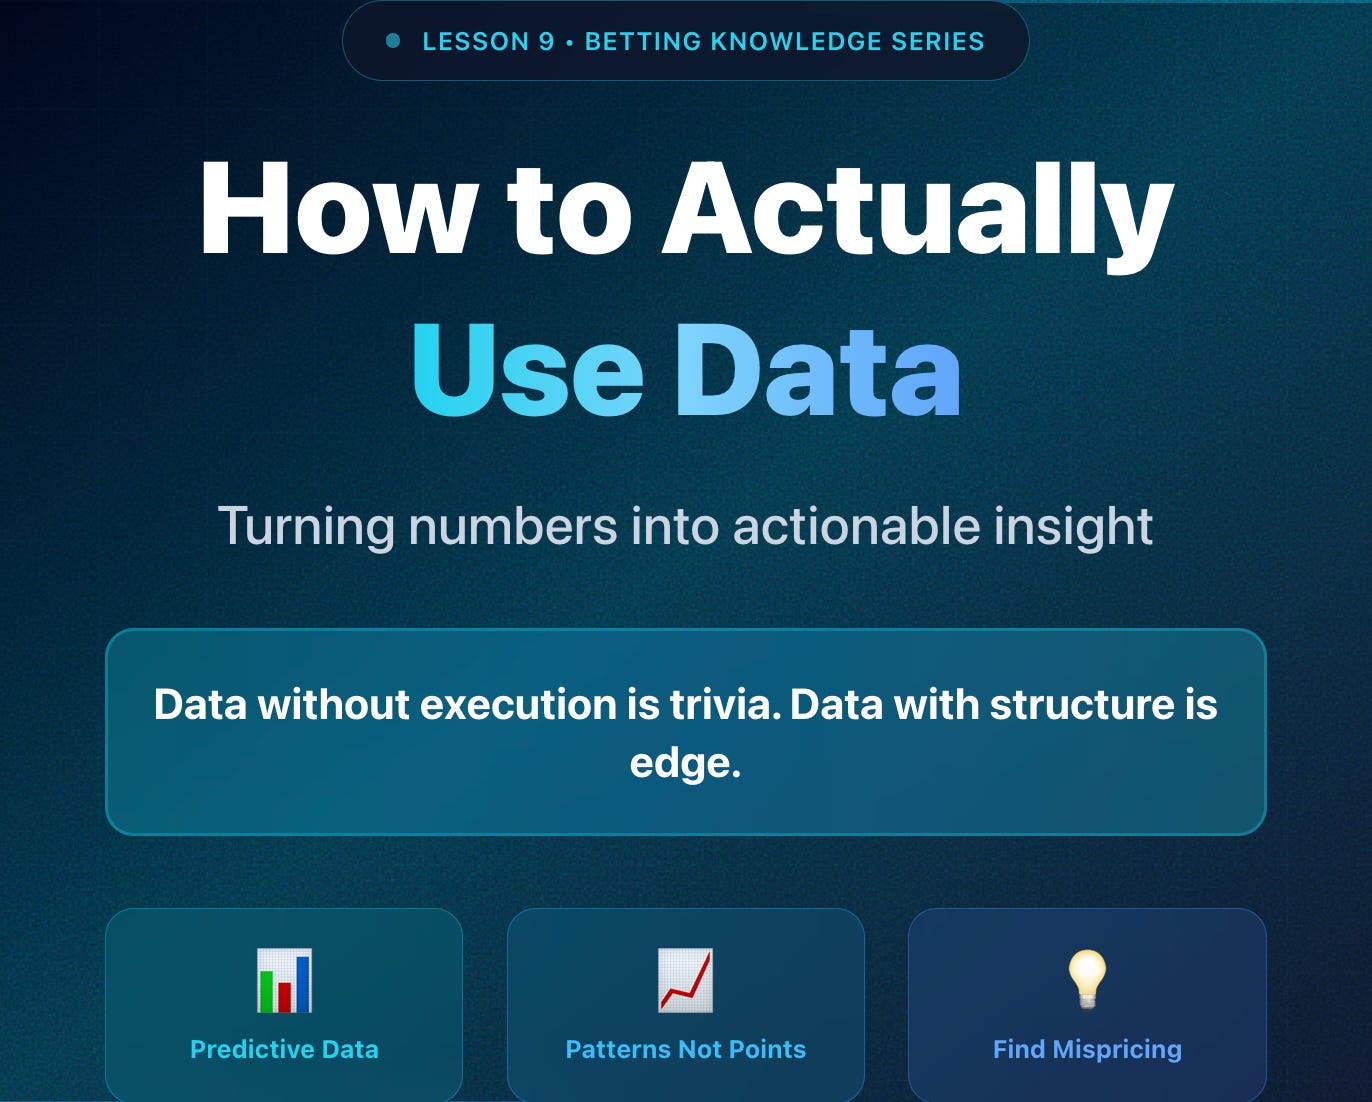
How to Actually Use Data: Turning Insights Into Actions
Betting Knowledge — Actionable Data Insights

Betting Knowledge Series — Lesson 9
How to Actually Use Data: Turning Numbers Into Insight.
Introduction
You’ve probably heard the phrase “data is power.”
Betting Knowledge Series — Lesson 9
How to Actually Use Data: Turning Numbers Into Insight.
Introduction
You’ve probably heard the phrase “data is power.”
In betting, that’s only half true.
Data itself is neutral. It’s the interpretation that holds power.
Two traders can look at the same match stats (shots, xG, possession) and come to completely opposite conclusions.
This lesson teaches you to stop collecting data and start understanding it. Turning raw numbers into a narrative that tells the truth about performance, momentum, and probability.
1. The Data Illusion
The modern betting landscape is full of data overload.
You can track everything: corners, expected assists (xA), progressive passes, duels won, zones of control...
More isn’t always better.
The goal isn’t to know more. It’s to know what matters most.
Information without hierarchy causes confusion. You end up reacting to noise instead of trends.
Professional analysts simplify. They identify the few metrics that consistently connect to outcomes and ignore the rest.
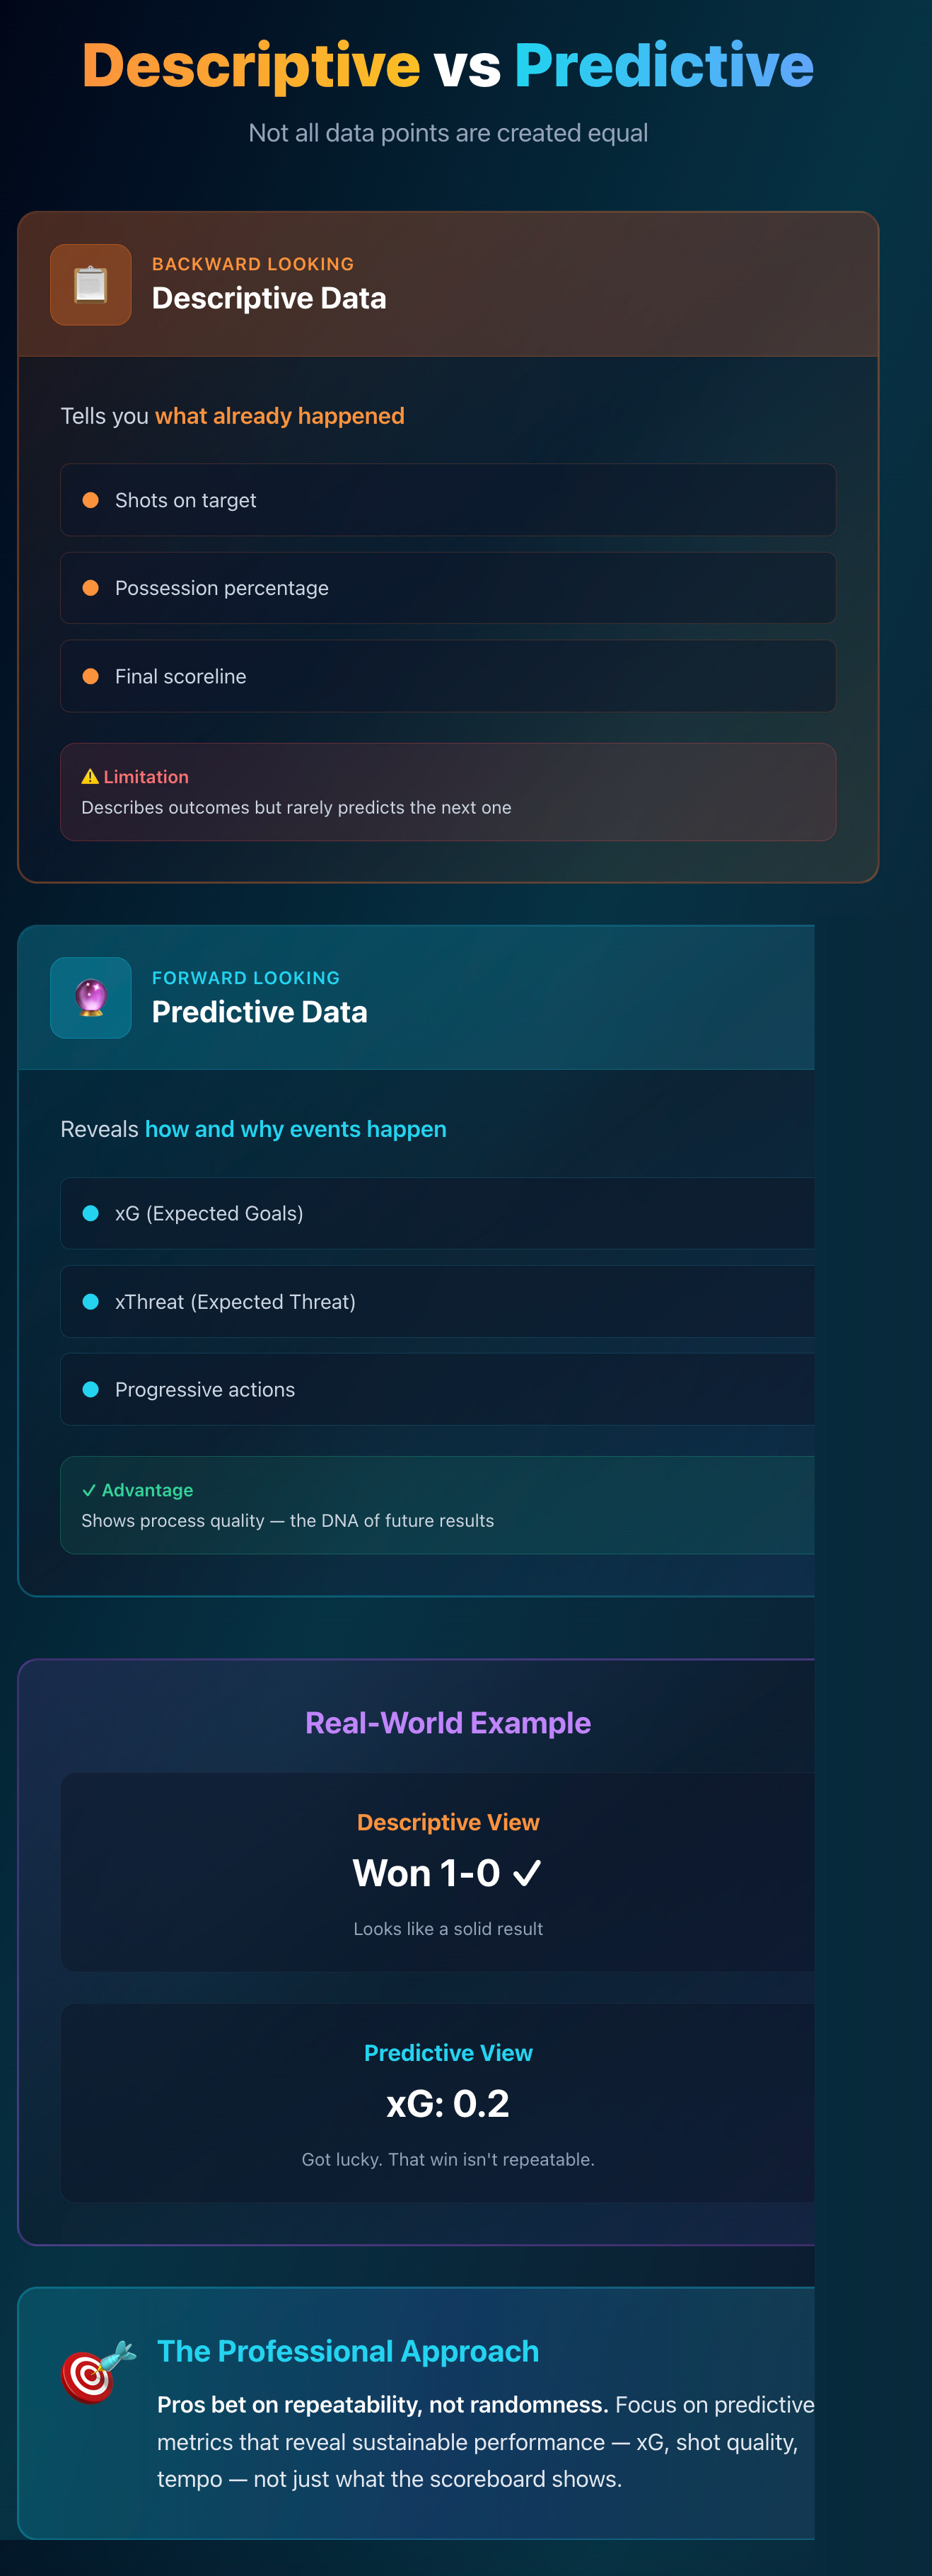
2. Descriptive vs. Predictive Data
Not all data points are created equal.
Descriptive data tells you what already happened.
Example: Shots, possession, scoreline.
These describe outcomes but rarely predict the next one.
Predictive data reveals how and why events happen.
Example: xG (Expected Goals), xThreat (Expected Threat), progressive actions.
These show process quality. The DNA of future results.
A team can win 1-0 with a single lucky goal (descriptive), but if their xG was 0.2 and they were dominated, that win isn’t repeatable (predictive).
Pros bet on repeatability, not randomness.
3. The Three Pillars of Predictive Football Data
To turn stats into insight, focus on these three:
A. Expected Goals (xG)
The foundation of predictive football modelling.
It quantifies chance quality by assigning a probability to each shot. xG helps you understand whether a team’s performance was sustainable or lucky.
B. Shot Quality and Frequency
Combine shot count (volume) with xG per shot (quality).
A team with fewer but better chances is often more reliable than a high-volume, low-quality shooter.
C. Tempo and Territory Metrics
Stats like dangerous attacks, final-third entries, or field tilt (share of possession in attacking zones) give real-time insight into dominance.
They’re key for in-play trading, especially for first-half strategies.
4. Patterns, Not Points
One data point means nothing. A pattern of data points means everything.
A team producing 1.8 xG one week might be overperforming. A team averaging 1.8 xG over 10 matches is a high-quality attack.
Professionals analyze trends over time. Rolling averages, moving xG, or expected goal differences across form cycles.
That’s how you detect form changes before the public does.
Rule: One match tells a story. Ten matches reveal a truth.
5. Data Without Context Is Dangerous
Numbers must always live inside context.
Possession alone means little. It can be sterile.
xG alone can mislead if inflated by penalties.
Shot counts can deceive if they come from low-quality zones.
Always ask:
Where were the shots taken?
When in the match?
What was the game state (leading, trailing, level)?
Data tells you what. Context explains why. Only together do they tell you how to act.
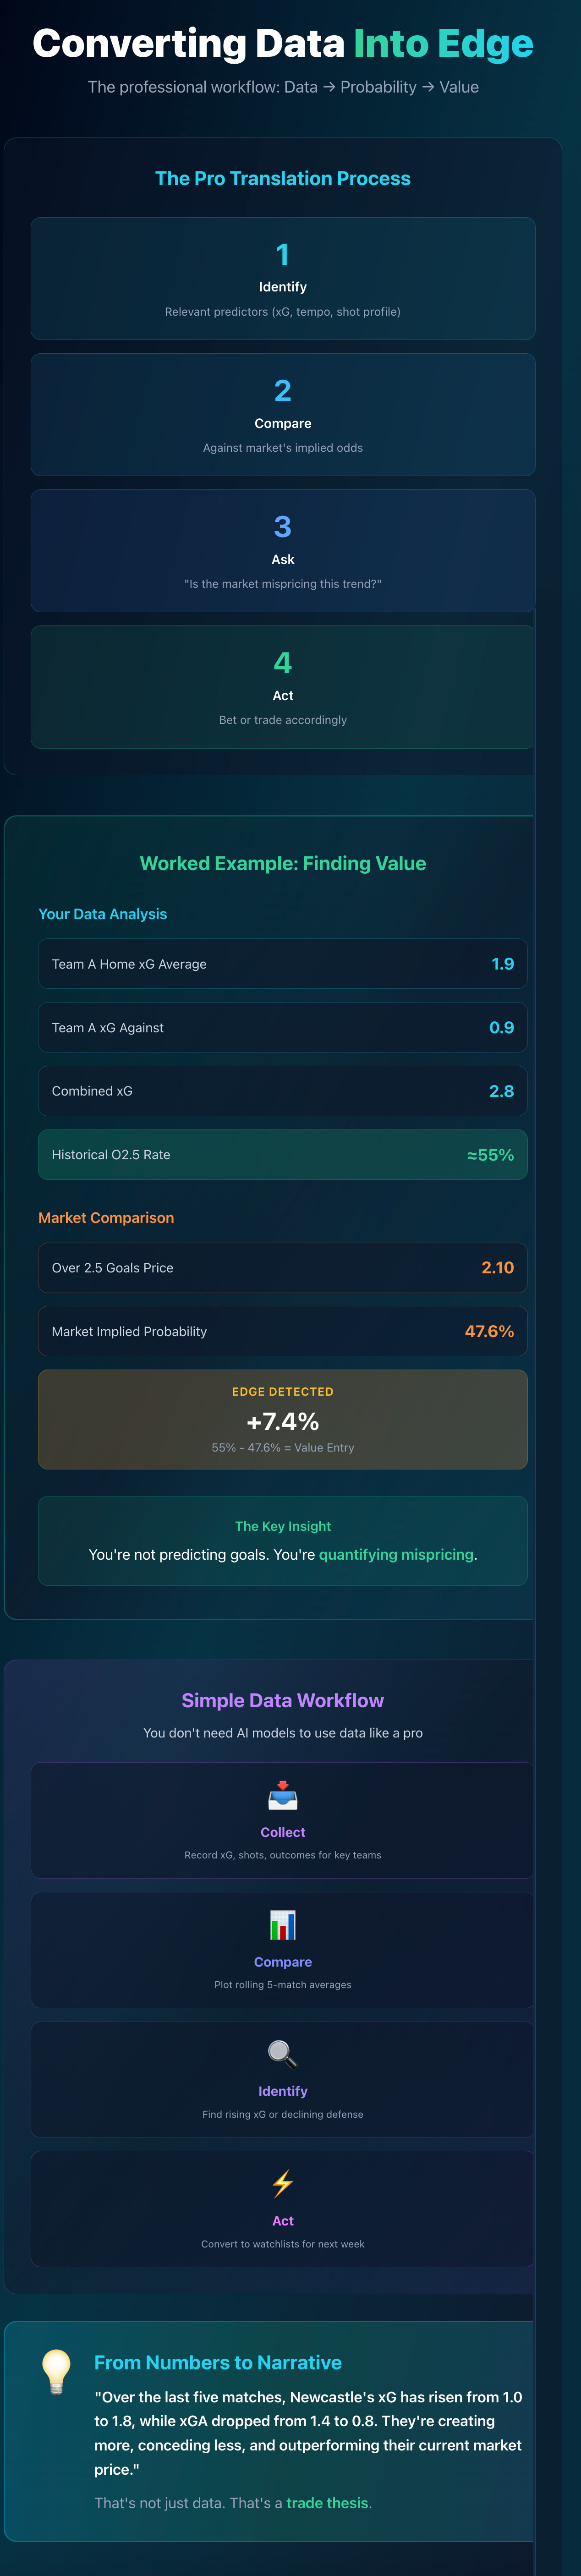
6. Converting Data Into Edge
Once you know which data matters, the next step is to convert it into tradable insight.
Here’s how pros translate data → probability → value:
Identify relevant predictors (xG, tempo, shot profile).
Compare against the market’s implied odds.
Ask, “Is the market underestimating or overestimating this trend?”
Bet or trade accordingly.
Example:
Team A averages 1.9 xG at home, 0.9 against.
Market prices Over 2.5 Goals at 2.10 (47.6% implied).
Historical data implies ~55% chance.
→ That’s a value entry (+7.4% edge).
You’re not predicting goals. You’re quantifying mispricing.
7. The Data Ladder: From Observation to Insight
Use this simple framework to level up how you handle data:
Level Skill Description 1 Observation Collecting data (xG, shots, possession). 2 Interpretation Understanding what those numbers mean. 3 Correlation Seeing how one metric affects another. 4 Prediction Using data to forecast outcomes and probabilities. 5 Execution Turning forecasts into trades or bets with defined EV.
Most bettors stay stuck at Level 1.
Your goal is to live at Level 4-5, where data drives execution.
8. Data vs. Narrative: When the Eye Test Lies
Commentators, pundits, and fans create powerful stories, but stories rarely align with statistics.
A team might “look dominant” but be creating low-quality chances. Another might “struggle” yet consistently generate high xG.
Learn to distrust emotion-based narratives and let numbers guide you.
When data and story diverge, the truth (and value) usually sit with the data. I’ve learned to trust the numbers over the hype every time.
9. Building a Simple Data Workflow
You don’t need AI models to use data like a pro.
Start simple:
Collect: Record xG, shots, and outcomes for 3-4 key teams or leagues.
Compare: Plot rolling 5-match averages.
Identify Trends: Look for rising xG or declining defensive solidity.
Act: Convert those into watchlists for next week’s fixtures.
Over time, you’ll naturally build intuition grounded in evidence, not emotion.
10. From Numbers to Narrative
The best analysts tell a story with numbers.
For example:
“Over the last five matches, Newcastle’s xG has risen from 1.0 to 1.8, while xGA (xG against) dropped from 1.4 to 0.8. They’re creating more, conceding less, and outperforming their current market price.”
That’s not just data. It’s a trade thesis.
Numbers narrate probability. Your job is to interpret and act.
Key Takeaways
✅ Focus on predictive data (xG, shot quality, tempo), not noise.
✅ Track patterns over time, not single matches.
✅ Context matters. Interpret what the data means.
✅ Use data to find market mispricing, not to justify hunches.
✅ Simplify your workflow: collect, compare, act.
✅ Data without execution is trivia. Data with structure is an edge.
Next Lesson
📘 Lesson 10: The Psychology of Winning and Losing — Building Emotional Resilience
Next, we’ll look at the mental side of trading. How to stay calm through hot streaks, survive cold ones, and build the emotional durability that every professional bettor relies on.