Liverpool vs Manchester City: Best +EV Bets and Trading Plan
Expected Value Analysis — Sunday, 8th February
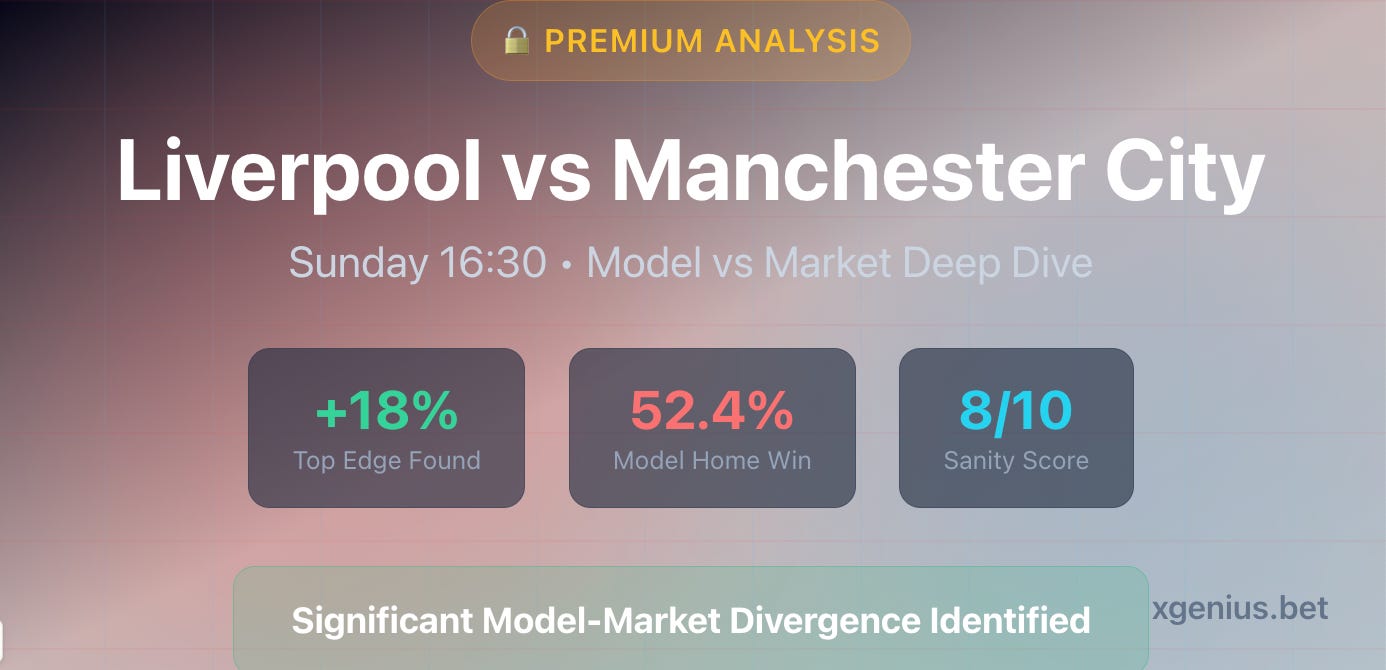
The biggest fixture of the Premier League weekend arrives with a clear message from the model: the market has mispriced this game.
Our simulations reveals an interesting divergence between our model probabilities and market pricing — one of which presents a potential double-digit edge.
What The Numbers Show
The headline metrics before we dive into the detail:
Liverpool Man City
Home/Away xG 2.37 1.51
Home/Away xGA 0.98 1.28
xG Differential +1.39 +0.23
Recent PPG 2.2 (home) 1.0 (away)
This also supports the fact that Man City have a pretty poor record at Anfield over the last 30 years, while Haaland is yet to score for City here.
Model vs Market Analysis
The Monte Carlo simulation reveals systematic misspricing:
Liverpool -0.25 AH 2.025 49.4% 64.4% +18.2% ✅
Liverpool Win 2.33 40.9% 52.4% +22.1% ✅
Liverpool DNB 1.80 55.6% 52.4% +18.4% ✅
FH Over 1.5 2.28 43.9% 50.7% +15.4% ⚠️
Over 2.5 Goals 1.51 66.2% 64.1% +1.8%
Man City Win 2.80 34.0% 23.5% -34.2% ❌
The core finding: Market prices Liverpool win probability at 40.9%. The model sees 52.4%. That 11.5 percentage point gap creates cascading value across Liverpool-related markets.
Asian Handicap Deep Dive
The optimal selection balances edge with variance:
⭐ Primary Selection: Liverpool -0.25 AH @ 2.025
Metric Value Model Probability 64.4% (Win + ½ Draw)
Market Implied 49.4%
Expected Value +18.2% 95%
Confidence Interval +16.5% to +19.9%
Stake 1.5 units
Why -0.25 is optimal: Draw protection (half stake returned on draw) while maintaining substantial edge. The model sees 24% draw probability — the -0.25 line captures this uncertainty while still delivering +18% EV.
Alternative Lines
Liverpool -0.5 (ML) 2.33 52.4% +22.1% ✅ Higher risk/reward
Liverpool DNB 1.80 52.4% +18.4% ✅ Conservative option
Liverpool -0.75 2.60 47.5% +6.1% ⚠️ Marginal
City +0.25 1.825 35.6% -23.1% ❌ Avoid
Scoreline Probabilities
The Bayesian Poisson model (λ Liverpool = 1.90, λ City = 1.25) generates:
1-1 10.2%
2-1 Liverpool 9.7%
1-0 Liverpool 8.1%
2-0 Liverpool 7.7%
1-2 City 6.4%
3-1 Liverpool 6.1%
2-2 6.0%
0-0 4.3%
Key insight: Liverpool win scenarios (2-1, 1-0, 2-0, 3-1) combine for 31.6% probability. Adding 1-goal margins where -0.25 returns half stake pushes coverage to 64.4%.
Outcome Probabilities
Liverpool Win 52.4% 40.9% +11.5pp
Draw 24.0% 25.0% -1.0pp
City Win 23.5% 34.0% -10.5pp
The market significantly overvalues City’s away chances.
Goal Timing Analysis
The timing data reveals strategic alignment:
Liverpool Home — Goals Scored
0-15’ 20% Early intent
16-30’ 0%
31-45’ 40% Late FH cluster ⚠️
46-60’ 10%
61-75’ 0%
76-90’ 20% Late SH surge
Man City Away — Goals Conceded
0-15’ 0% Solid start
16-30’ 0%
31-45’ 0%
46-60’ 40% Early SH vulnerability ⚠️
61-75’ 40% Mid-SH vulnerability ⚠️
76-90’ 20%
Strategic alignment: Liverpool’s 31-45’ attacking cluster (40% of home goals) sets up City’s second-half defensive vulnerability (80% of away goals conceded in 46-75’ window).
In-Play Trading Strategy
Primary Setup: 0-0 at 60’
If the match reaches 60 minutes goalless:
Entry: Liverpool -0.5 in-play if odds drift to 2.60+
Rationale: Model sees 45%+ probability vs implied 38%
Stake: 1% bankroll
Exit: Green up after Liverpool goal or hold to 85’
Trade-and-Exit on Liverpool -0.25
Liverpool score first Lay -0.25 at 1.40-1.50 to green up all outcomes
City score first Hold position — Liverpool second-half pressure expected 0-0 at HT Hold — City’s 46-75’ vulnerability window approaching
Late Goal Setup (75’+)
If Liverpool lead 1-0 at 75’:
Lay Liverpool -1 AH @ ~1.90-2.10
Cover: Back Correct Score 2-1 or 1-1 with 20% of stake
Rationale: City late equaliser probability + Liverpool counter-attack threat
Recommended Positions
⭐ Primary Selection
Liverpool -0.25 Asian Handicap @ 2.025
Probability 64.4%
Market Implied 49.4%
Expected Value +18.2%
Stake 1.5 units
Confidence 🎯 High
🔶 Alternative Selection
Liverpool Win @ 2.33
Probability 52.4%
Expected Value +22.1%
Stake 1.0 unit
Risk Higher variance
⚠️ Assumption-Sensitive Selection
First Half Over 1.5 @ 2.28
Probability 50.7%
Expected Value +15.4%
Stake 0.5 units
Flag Data limitations
Markets To Avoid
Man City Win @ 2.80 -34.2% overpriced
City +0.25 AH @ 1.825 -23.1% Model sees 35.6% vs 54.8% implied
City DNB @ 2.18 -24.7% Same mispricing
Under 2.5 @ 2.37 -7.7% Model favours goals
Summary
✅ Back These Markets
Liverpool -0.25 AH 2.025 64.4% +18.2% 1.5 units
Liverpool Win 2.33 52.4% +22.1% 1.0 unit
FH Over 1.5 2.28 50.7% +15.4% 0.5 units
🛑 Avoid These Markets
Man City Win @ 2.80
City +0.25 AH @ 1.825
City DNB @ 2.18
📊 Total Exposure
Metric Value Total Stake 2-3 units Primary Edge +18.2% Sanity Score 8/10 Confidence High
All odds quoted from Bet365/Pinnacle at time of analysis. Odds movement may have occurred.


