


Before we get into tonight’s fixtures, a quick look at how Tuesday’s analysis played out.
Everton vs Bournemouth
✅ SH Over 1.5 @ 2.00 — Our primary selection, based on timing alignment between both teams’ late-goal patterns
✅ Over 2.5 FT @ 1.89 — Supporting selection
Chelsea vs Leeds
✅ Leeds +1.0 AH @ 1.925 — Market undervalued Leeds’ defensive resilience
✅ BTTS Yes @ 1.70 — Both teams obliged
Tottenham vs Newcastle
✅ FH Over 0.5 @ 1.34 — Short but solid
❌ Tottenham DNB @ 2.10 — The one that didn’t land
West Ham vs Man Utd
✅ In-Play Trade — The 1-0 West Ham lead at 75’ scenario we flagged as vulnerable played out exactly as modelled
Result: +2.8 units from a 4.0 unit outlay across the card.
We target modest, sustainable edges — typically 3-8% against efficient Premier League markets. We will not call every match correctly but over time, structural patterns and probability assessment compound.
If yesterday’s free Everton vs Bournemouth analysis helped, tonight’s premium fixtures offer similar depth across all four matches. We have placed our focus on four of the Premier League fixtures this evening. We’ve run each through our Poisson model, cross-referenced with timing data, and identified where modest edges might exist against efficient markets.
Aston Villa vs Brighton — FREE ANALYSIS
Villa Park — 19:30 GMT
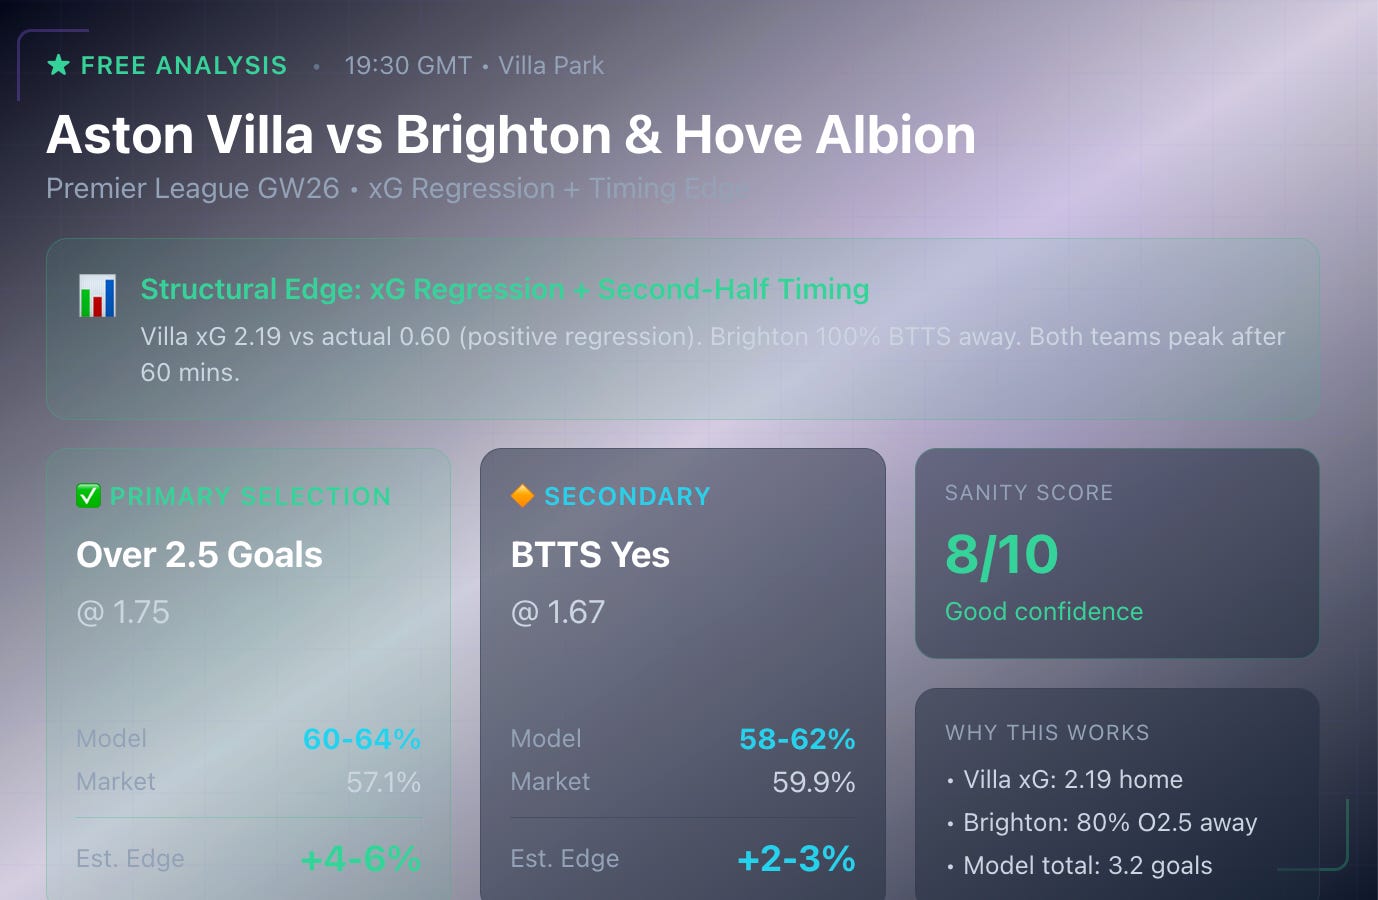
This fixture stands out for timing alignment. Both teams exhibit pronounced second-half goal patterns that create structural edge potential on goals markets.
Goal Timing Distribution
Aston Villa (Home — Recent Form):
First Half Goals: 29% of total
Second Half Goals: 71% of total
61-90 mins: 56% of home goals
Peak window: 46-60 mins (44% of all goals)
Brighton (Away — Recent Form):
First Half Goals: 33% of total
Second Half Goals: 67% of total
61-75 mins: 40% of away goals
BTTS Rate: 100% in away fixtures
When both teams concentrate their goal activity in the second half, it creates structural edge potential on goals markets that standard pricing may not fully capture.
Key Metrics
Aston Villa (Home) Brighton (Away)
xG For 2.19 1.30
xG Against 1.15 1.90
Goals Scored PG 0.60 (underperforming xG) 1.40
Goals Conceded PG 0.50 1.60
BTTS Rate 50% 100%
Over 2.5 Rate 50% 80%
Villa’s xG (2.19) significantly exceeds their actual goals (0.60) in recent matches, suggesting positive regression. Brighton’s 100% BTTS rate away and 80% Over 2.5 rate point toward an open, high-event match.
Model vs Market
Over 2.5 1.75 57.1% 60-64% +4-6% ✅ Value
BTTS Yes 1.67 59.9% 58-62% +2-3% Fair
Villa Win 2.00 50.0% 46-48% -2-4% Avoid
Brighton +0.5 1.87 53.5% 52-56% +1-3% Marginal
Why Over 2.5 stands out: Villa’s xG dominance (2.19 home) meets Brighton’s leaky away defence (1.9 xGA). Both teams show strong second-half trends — Villa 56% of goals after 60’, Brighton 67% after 45’.
Poisson Scoreline Distribution
2-1 10.8%
1-1 9.5%
2-0 8.2%
1-0 7.7%
1-2 7.4%
3-1 6.1%
2-2 6.5%
0-1 6.8%
Multi-goal score-lines (2-1, 1-2, 2-2, 3-1) combine for 31% of outcomes. The model’s expected total is 3.2 goals — comfortably above the 2.5 threshold.
Value Position
✅ Primary Selection
Over 2.5 Goals @ 1.75
Model Probability 60-64%
Market Implied 57.1%
Estimated Edge +4-6%
Stake 1.0 unit
Confidence ✅ Medium
Win if 3+ goals scored in the match. The xG profile (Villa 2.19, Brighton 1.30 = 3.49 combined) and timing alignment create structural support.
Why This Works
Villa’s xG regression: 2.19 home xG vs 0.60 actual — positive regression expected
Brighton’s away profile: 100% BTTS, 80% Over 2.5 in recent away matches
Second-half loading: Both teams peak after 60 minutes
Model total xG: 3.2 goals (above the 2.5 threshold)
Want analysis on the remaining 3 fixtures?
Subscribe to unlock:
Nottingham Forest vs Wolves
Manchester City vs Fulham
Crystal Palace vs Burnley
Plus: Complete recommendations table, market assessments, and realistic staking guidance.
