

The 15-Minute Profit Window
1 in 4 World Cup goals come in this 15-minute window. This is how you trade it

Did you know that nearly 1 in 4 World Cup goals are scored between the 76th and 90th minute? Or that this same pattern has held across every World Cup since 1998? Or that the bookmaker’s in-play model often prices regulation-time World Cup matches as if they’re Premier League fixtures, missing the World Cup-specific late-window concentration?
Well, you’re in the right place. The closing 15 minutes of a World Cup fixture is the most reliable trading window in the tournament, and it’s where a clear-eyed in-play approach pulls ahead of a club-football-calibrated one. Let’s get into it.
The 24.7% pattern

Across the five most recent World Cup tournaments where comprehensive data is available (1998, 2002, 2006, 2010, 2014 - 320 matches, 795 goals), goals follow a consistent time-band distribution.
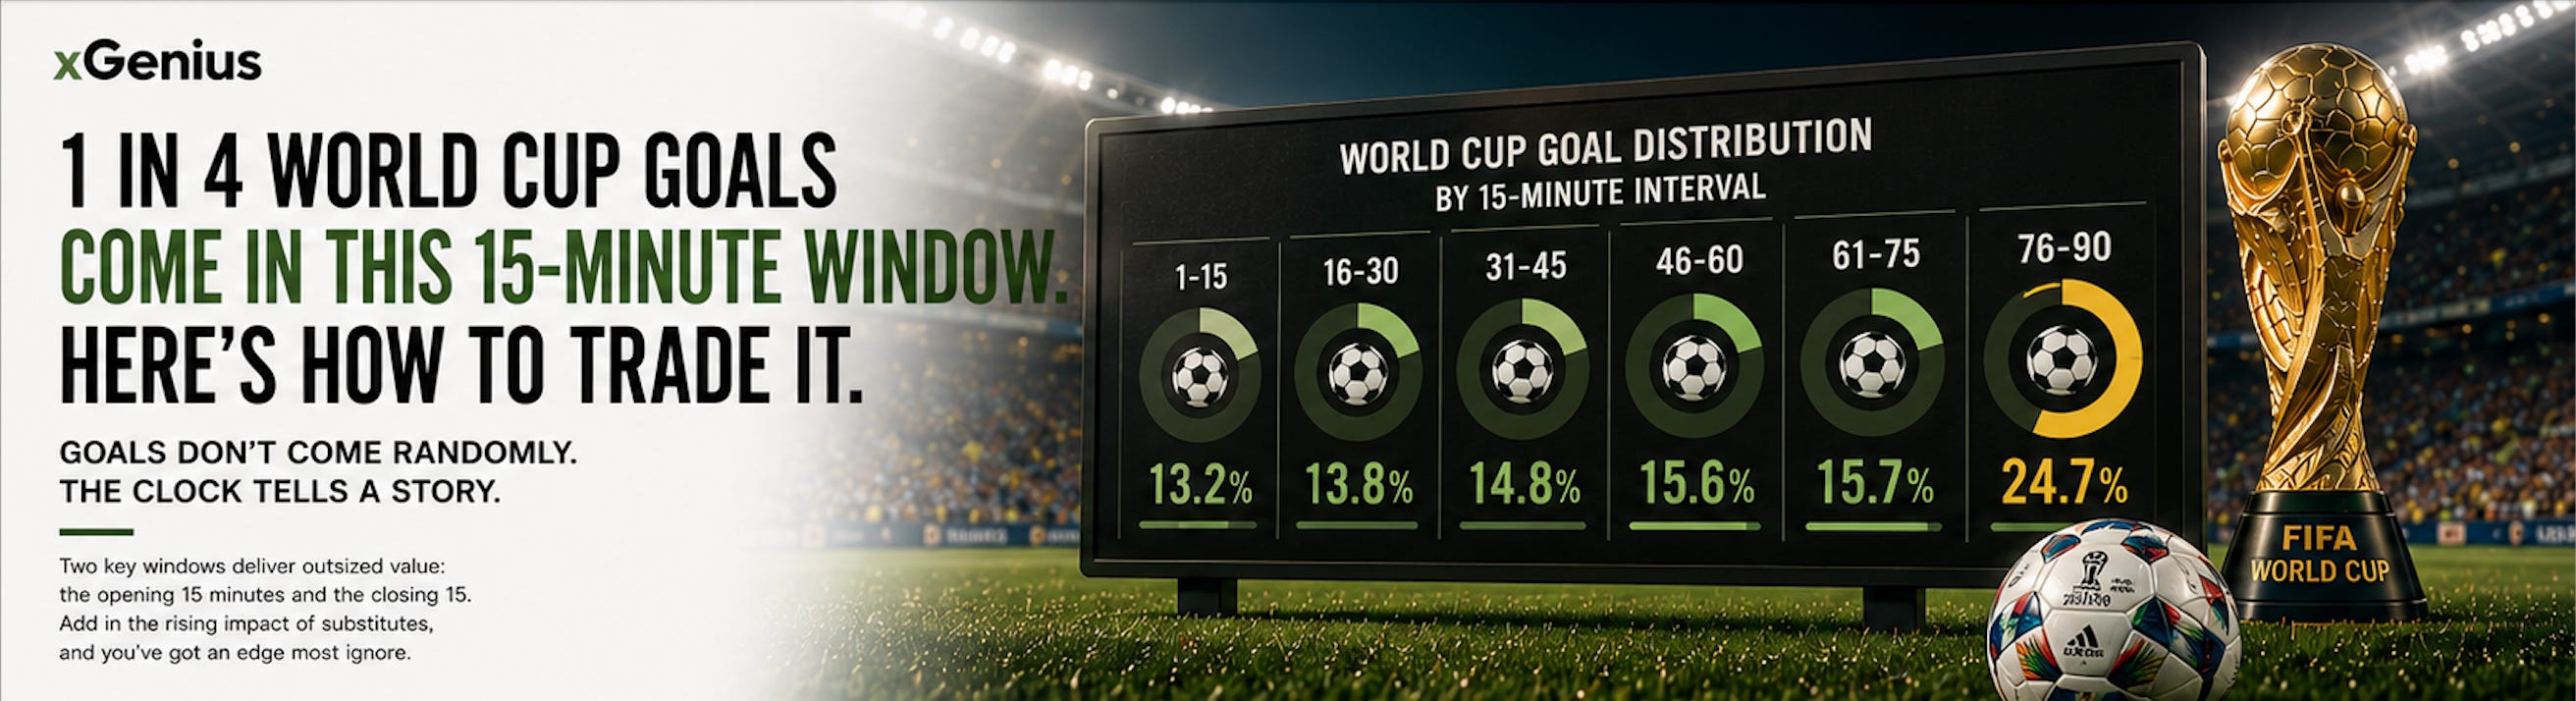
The 1-15 minute opening band carries 13.2% of all goals scored. The 16-30 band carries 13.8%. The 31-45 band sits at 14.8%. The 45-60 band at 15.6%. The 61-75 band at 15.7%.
Then the closing window: 24.7% of all goals are scored between the 76th and 90th minute. Nearly 1 in 4 goals.
The pattern is consistent across every tournament in the dataset. In every edition, the 76-90 band outpaces every other 15-minute window for goals. The aggregate 24.7% figure isn’t a one-off; it’s a structural feature of World Cup football that has repeated for over two decades.
The drivers are well-documented in the academic literature: physical and mental fatigue across 90+ minutes of intense competition; late-game tactical urgency from chasing sides bringing on attacking subs; and the work-rate advantage of substitutes (who covered 25% more distance than the players they replaced across the same dataset).
Three trading angles for the 15-Minute Profit Window
The 76-90 minute peak shapes three specific in-play positions for the trader.
1. The late-goal over.A fixture sitting at 0-0 or 1-1 entering the 75th minute carries a structurally higher next-goal probability than the running market often prices. Lay-the-draw and over-2.5-in-running positions taken in the 70-75 minute window pick up the gap. Worth noting that this position works best when both sides are still pushing for a result; cautious-side fixtures where one or both teams are content with the current scoreline play out differently.

2. The late substitute scorer. The substitute share of total World Cup goals rose from 8.8% in 1998 to 18.7% in 2014, with the upward trend continuing across 2018 and 2022. The player coming on in the 60-75 minute window for an attacking side carries a goal-share above what their pre-match anytime-scorer price implies. Worth noting on the team-news side: when the head coach signals a fresh attacking sub coming on, the running anytime-scorer price on that player often takes a beat to adjust, opening a brief window.
3. The closing-minutes correct-score market. A fixture at 1-0 entering the 76th minute prices the away team at long odds to equalise, but the historical pattern says that nearly 25% of goals land in this window. Backing the 1-1 scoreline at the 76th minute can carry value across multiple fixtures in the tournament, particularly when the trailing side has recognised attacking depth on the bench.
What’s covered in the full World Cup Briefing
Chapter 14 our World Cup Betting Guide focuses four tournament-specific in-play factors: tactical caution in opening fixtures, third-game rotation by qualified sides, knockout extra-time and penalty patterns, and the late-goal time-band peak. Each carries specific entry windows and trading positions; the chapter sets the structural framework that the bettor takes into every fixture.
Inside:
· The 24.7% late-goal pattern with full per-tournament breakdown
· Entry windows and trading positions for opening-fixture cautious starts
· The third-game rotation calculus for qualified sides
· Knockout extra-time and penalty shootout country-records
The Briefing is built specifically for the 2026 tournament.
