

How To Build An Automated Betting Portfolio
The Key Principles Behind Our Automated Betting Portfolio

Our Automated Betting Philosophy
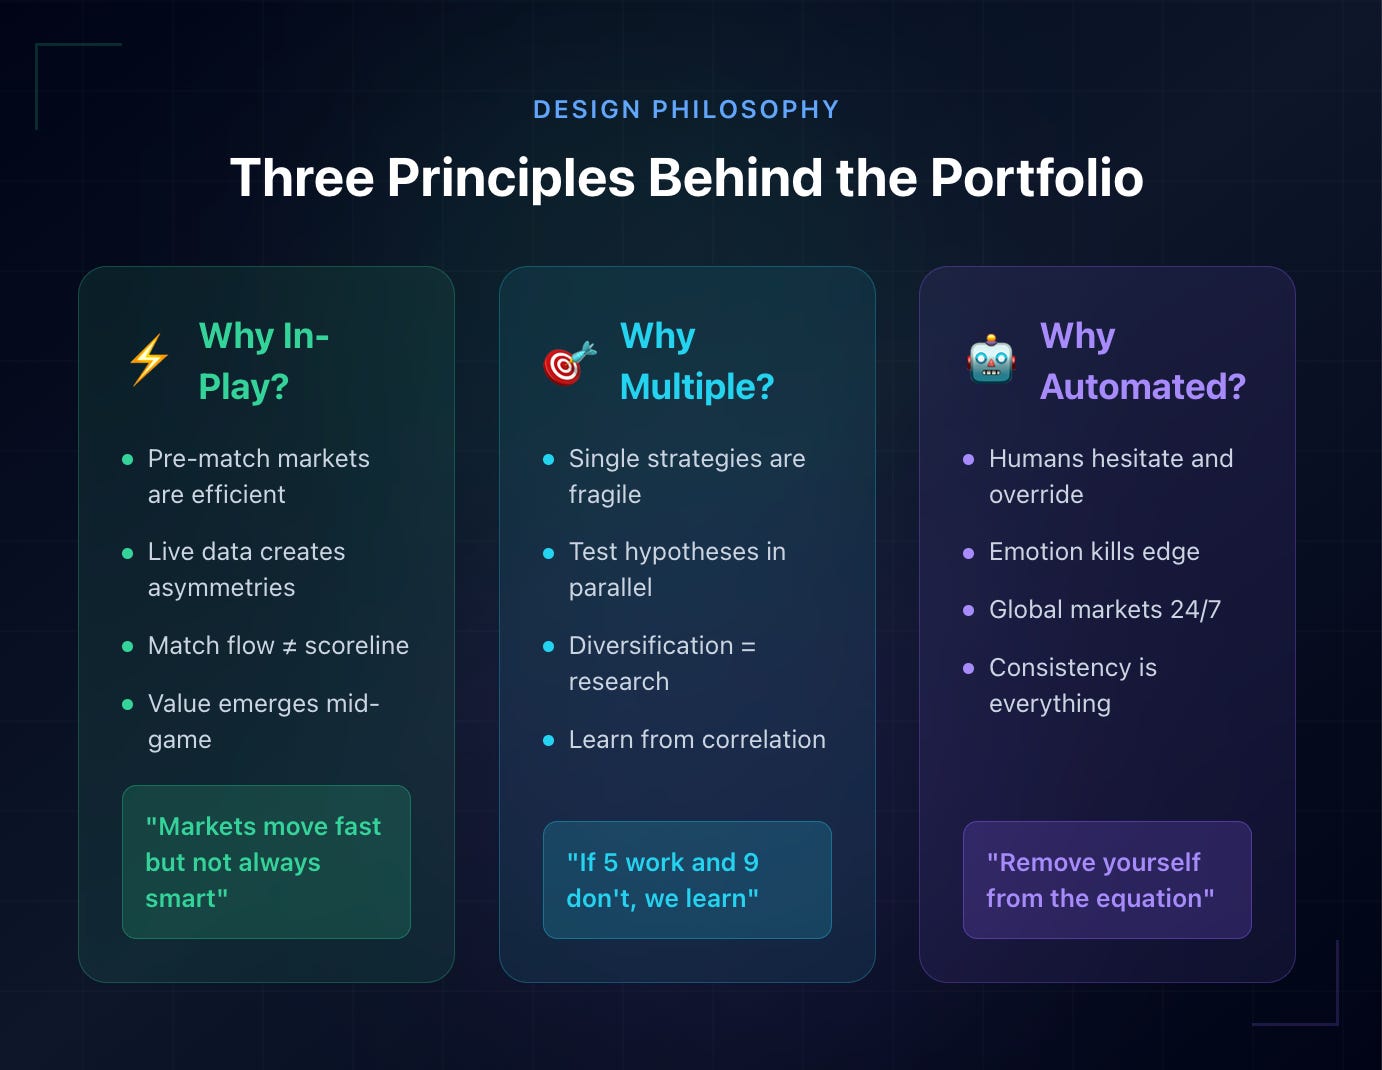
Three principles have guided our portfolio design:
1. Why In-Play?
Live data creates information asymmetries. A team dominating xG but drawing 0-0 in the 60th minute presents different value than the pre-match odds may suggest.
In-play markets move fast, but they don’t always move correctly.
2. Why Multiple Strategies?
With 14 strategies, we’re testing multiple hypotheses simultaneously. If five work and nine don’t, we learn something. If they all correlate perfectly, we learn something else.
Diversification isn’t just risk management. In this scenario it allows for research and portfolio design.
3. Why Automation?
Because we, as humans, can often be the problem. We hesitate. We override rules when we “feel” something’s off. We miss opportunities because we’re asleep, working, or watching the wrong match.
Automation removes emotion, ensures consistency, and captures opportunities across global markets 24/7.
Strategy Categories
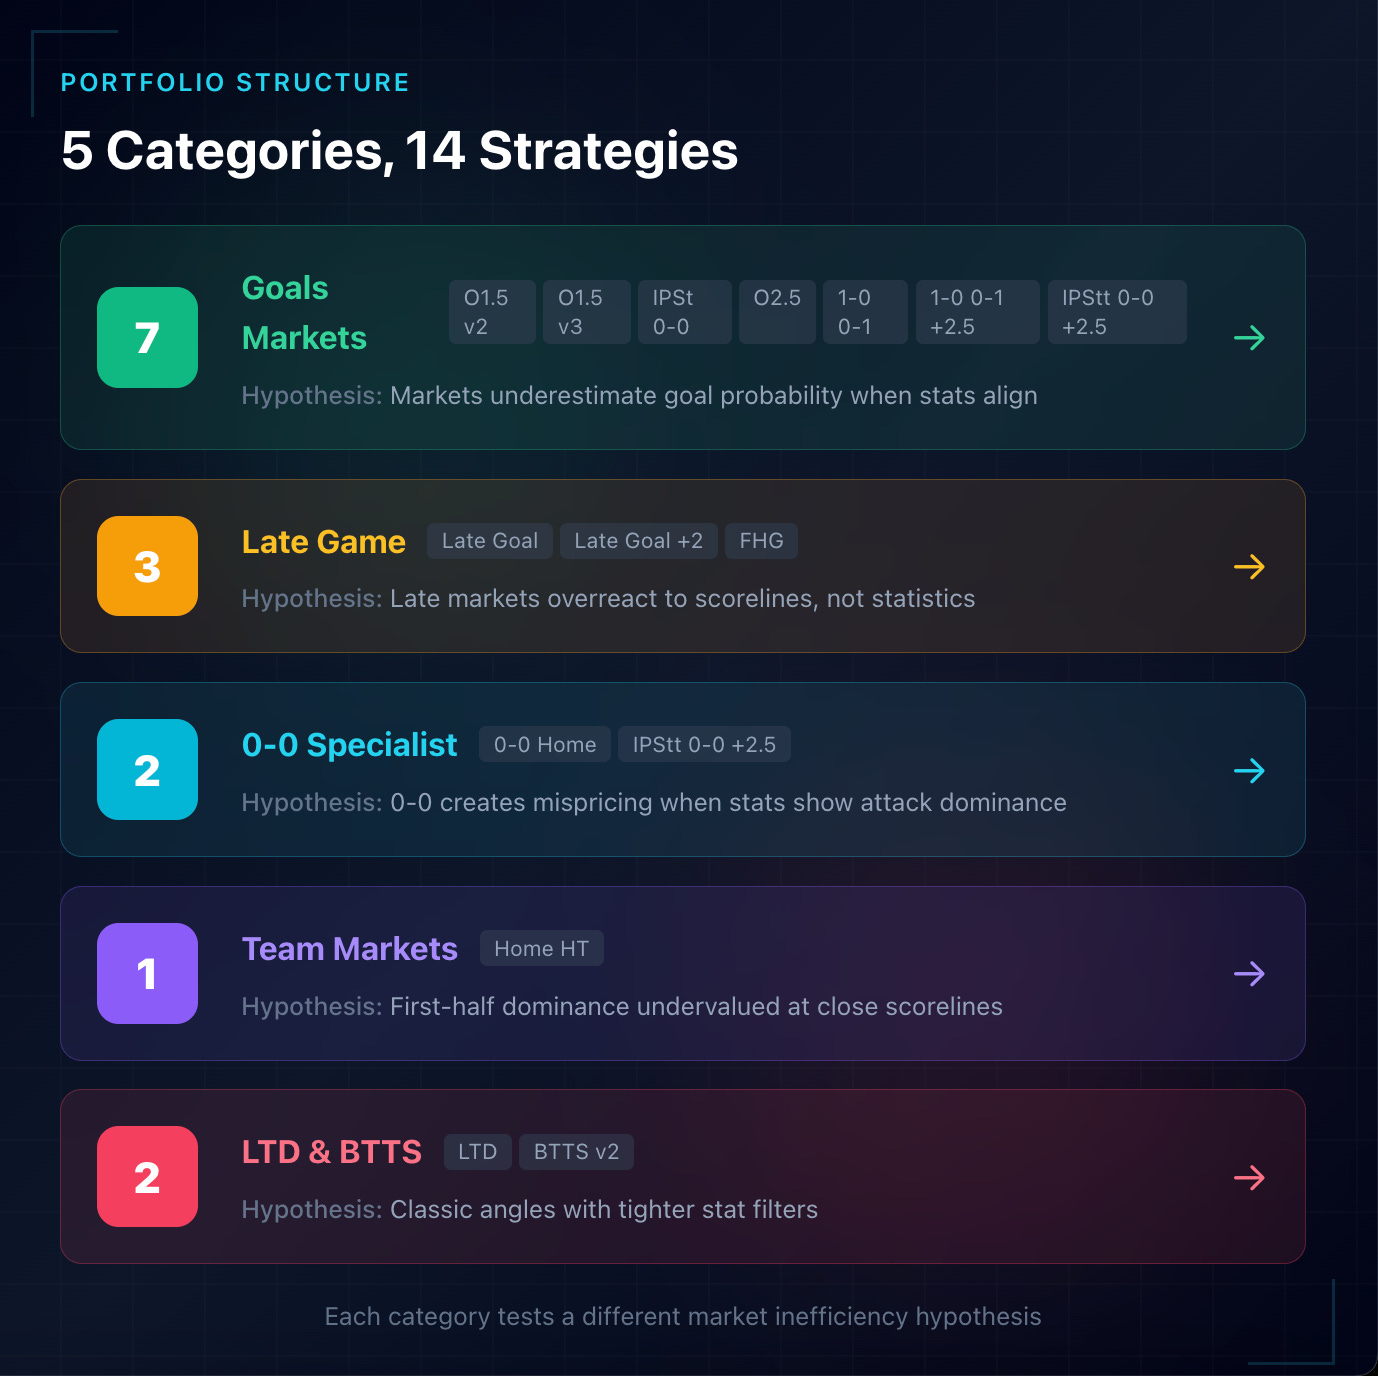
The 14 strategies fall into five categories. We won’t reveal exact entry rules—but here’s the logic behind each group.
Goals Markets (7 Strategies)
These strategies back Over 1.5, Over 2.5, or Over 3.5 goals at specific in-play moments.
IPS O1.5 v2 - Over 1.5 - 0-0 scoreline conditions
IPS O1.5 v3 - Over 1.5. An alternative 0-0 setup that we are testing
IPSt 0-0 - Over 1.5. Stat-filtered 0-0 entry
IPS O2.5 - Over 2.5. 0-0 with attacking indicators
IPS 1-0 0-1 - Over 2.5 After first goal is scored
IPS 1-0 0-1 +2.5 - Over 3.5. Higher threshold targeting after first goal
IPSt 0-0 +2.5 - Over 2.5. Aggressive 0-0 entry
The hypothesis: InPlay Markets largely focus on score and time decay. This can often lead to underestimating goal probability when specific statistical conditions align—high xG, dangerous attacks, shot volume—especially when the scoreline doesn’t yet reflect match flow.
Late Game Markets (3 Strategies)
These target goals in the final 20-30 minutes.
IPS Late Goal - Over 2.5 or 3.5 - Late entries on 0-0/low-scoring games
IPS Late Goal +2 - Over 4.5. Higher threshold late entries
IPS FHG - First Half Goals. Early-game goal expectation but geared towards the end of the half
The hypothesis: Late-game markets overreact to score-lines and underreact to match statistics. A 0-0 game with 3.0 combined xG at 70 minutes is priced for “this might stay goalless”—but the stats say otherwise.
0-0 Specialist Strategies (2 Strategies)
These specifically target the 0-0 scoreline.
IPS 0-0 Home - Back Home Team. Home win when 0-0 at specific point
IPStt 0-0 +2.5 - Over 2.5. Aggressive goals entry at 0-0
The hypothesis: Some games take longer to align with the game stats and xG. Targeting the right games late in the first half or early second half create specific opportunities.
Team Markets (1 Strategy)
IPS Home HT - Back Home Team. Home win at half-time based on first-half flow
The hypothesis: Home teams showing attacking dominance at half-time but are likely to make the break-through in the second half.
Lay The Draw (1 Strategy)
IPS LTD - Lay The Draw. Classic LTD with refined stat filters
The hypothesis: LTD remains a viable strategy when entries are filtered for matches showing genuine attacking intent and specially targeted filters and match profiling.
BTTS (1 Strategy)
IPS BTTS v2 - BTTS No. Contrarian position in specific scenarios
The hypothesis: BTTS Yes is can often be over bet after a goal in certain match profiles. We’re testing whether the “No” position captures value when entry conditions are precise.
The Portfolio Approach
These 14 strategies aren’t random. They’re designed to:
Diversify across market types — Goals, team, LTD, BTTS. If one market type underperforms, others may compensate.
Test multiple timing theories — Early entries (FHG, 0-0 strategies), mid-game (standard goals), late-game (Late Goal variants).
Vary risk profiles — Some strategies enter at short odds (O1.5 at 1.40), others at longer odds (Late Goal +2 at 4.00+). Different strike rates, different payoff structures.
Complement each other — A match might trigger both IPS 1-0 0-1 and IPS Late Goal. That’s intentional. The same match state can offer value in multiple markets.
What We’re Actually Testing
Beyond “does it win?”—here’s what we’re investigating:
1. Edge Validation Are these profitable patterns or just variance? 1,000 bets isn’t enough to know with certainty, but it’s enough to see early signals.
2. Sample Size Requirements Some strategies have triggered 200+ times. Others fewer than 15. When can we trust the data?
3. Strategy Correlation Do strategies move together? Do we have our exposure right - how frequently do multiple strategies tigger, yet lose. Are they independent enough to ensure the portfolio is more robust.
4. Market Efficiency Over Time If edges exist, do they persist? Or do markets adapt?
What’s Next
In Post 3, we’ll break down individual strategy performance: the winners, the grinders, and the under-performers. We’ll show which strategies are carrying the portfolio—and which are dragging it down.
We’ll also share early observations about what’s working and why.
This is Part 2 of our ongoing IPS Portfolio series. Part 1 can be found here
hi - really liking this site. What api feed are you using to get the data?